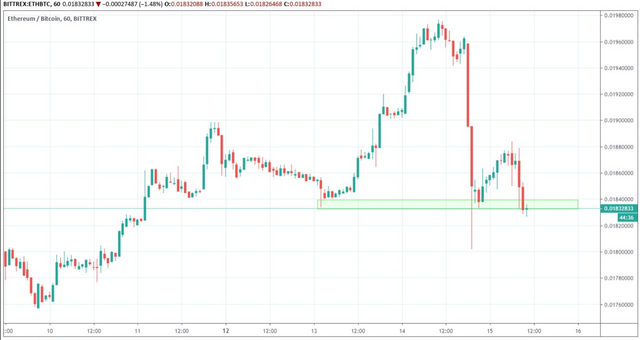
On August 9, 2019, the Ethereum price reached a low of ₿0.0175. An upward move began. The ETH price reached a high of ₿0.0197 on August 14. It has been decreasing since then.

At the time of writing, the ETH price was trading near ₿0.0182.
Will Ethereum initiate a reversal or do further decreases await? Continue reading if you are interested in finding out.
If you are interested in trading Ethereum (ETH) and other cryptocurrencies with a multiplier of up to 100x on our new partner exchange with the lowest fees, follow this link to get a free account!
Ethereum Price: Trends and Highlights for August 15
- ETH/BTC is trading inside a descending channel.
- There is support at ₿0.0183.
- The hourly RSI has developed bullish divergence.
- The Ethereum price is trading below the 10- and 20-day moving averages.
- Volume has been higher on bearish candlesticks.
Short-Term ETH Price Support
A closer look at the hourly ETH price gives us our first minor support area.It is found at ₿0.0183, a level where the Ethereum price is currently trading.
The two previous times it reached this area, (August 14-15) it began upward moves of varying magnitudes.
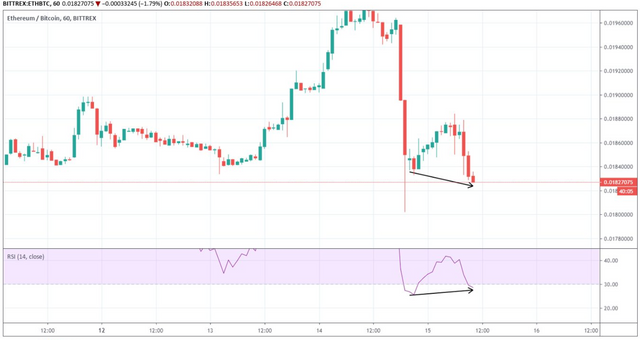
This idea is supported by a look at the hourly RSI.
It has generated bullish divergence over the past 24 hours.
However, the divergence is not very significant and is not present in longer-term time-frames.
Therefore, any upward moves resulting from it will most likely be temporary.
Let’s take a look at the daily time-frame to see how the recent price movement fits into a larger picture.
Descending Channel
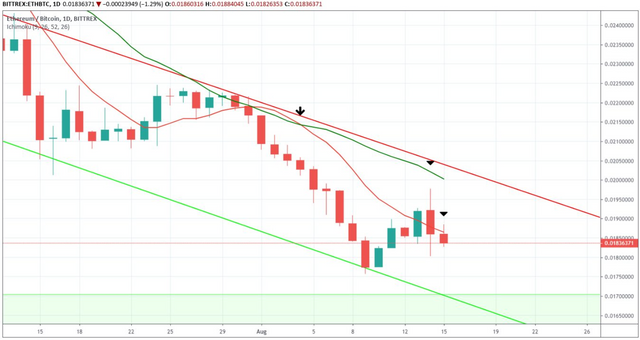
A look at the daily time-frame shows that Ethereum has been trading inside a descending channel since July 9.

At the time of writing, it was trading in the middle of the channel.
Additionally, there is a support area between ₿0.016 and ₿0.017.
If the Ethereum price were to decrease at the rate predicted by the channel, it would reach this area and the descending support line on August 20-25.
A look at moving averages supports this possibility.
A bearish cross between the 10- and 20-day MAs occurred on August 4.
The ETH price has been trading below both since then.
Yesterday, the price reached the 20-day MA before decreasing.
It is currently facing very close resistance from the 10-day MA.
Additionally, the volume was significantly higher during the bearish candlestick on August 14.

This makes us believe that ETH will decrease until it reaches the support area at ₿0.016 – ₿0.017.
[cryptocurrency_convert]
Summary
The Ethereum price has been trading inside a descending channel.
According to our analysis, it is likely to continue decreasing until it reaches the support area outlined above.
A short-term increase towards ₿0.019 could occur before the Ethereum price resumes its downward movement.
Do you think ETH will reach the support area? Let us know in the comments below.
Disclaimer: This article is not trading advice and should not be construed as such. Always consult a trained financial professional before investing in cryptocurrencies, as the market is particularly volatile.
Images are courtesy of TradingView and Shutterstock.
Posted from Cryptotreat Cryptotreat : https://cryptotreat.com/ethereum-eth-price-prediction-aug-15th-2019/


Warning! This user is on our black list, likely as a known plagiarist, spammer or ID thief. Please be cautious with this post!
If you believe this is an error, please chat with us in the #appeals channel in our discord.
Downvoting a post can decrease pending rewards and make it less visible. Common reasons:
Submit