This is my first chart so please don’t do anything based on this analysis. I’m learning, so this post is more of a pin in the map for me to come back to. Again...I really don't know what I'm doing.
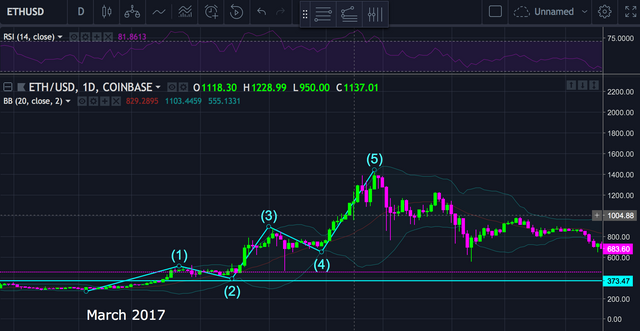
Ok. First, we haven’t seen Bollinger bands this tight since March 2017 right before the last bull run. If the next rally pierces the top of the RSI (like wave 1 did around 27 Nov 2017), I’m going to assume it marks the beginning of the next bull run.

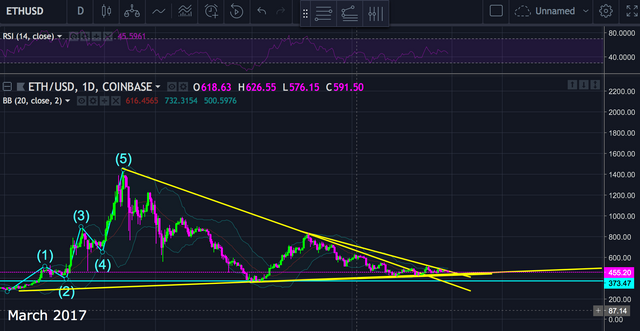
Second, the MACD is about to cross but more importantly, we have a massive descending triangle (3 actually – 2 minor DTs encased in a major). If (!) my next prediction (wave 1 to $850 and wave 2 finding support at $650) is correct, then it will confirm this as a bullish reversal triangle. If, instead of breaking out we drop below key support at $370 it’ll be a bearish continuation and the rest of this post will be rendered moot.

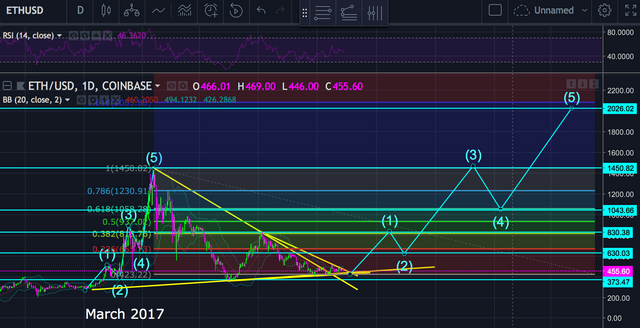
Prediction: Sept 2018 I think ETH will test the 0.382 for a target of $850, correct back down to the 0.23 for $630 before commencing a wave 3 run to previous ATH of $1450, correct to 0.618 for a big even of $1000. I expect the 5th impulse to take us on a final run until around 24 March 2019 for $2000 ETH.

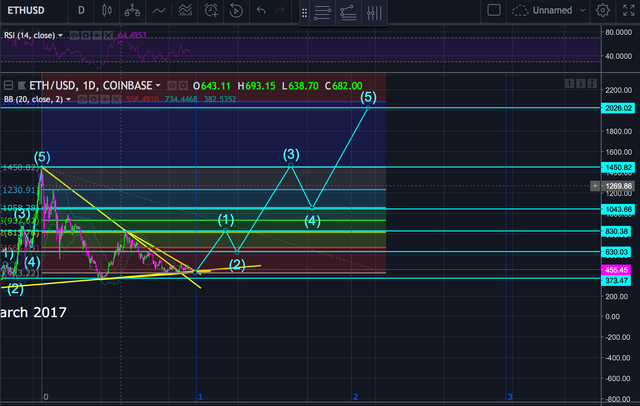
Third and finally, the fib time projection puts the ATH of wave 5 right around Zone 2.

Either way:
