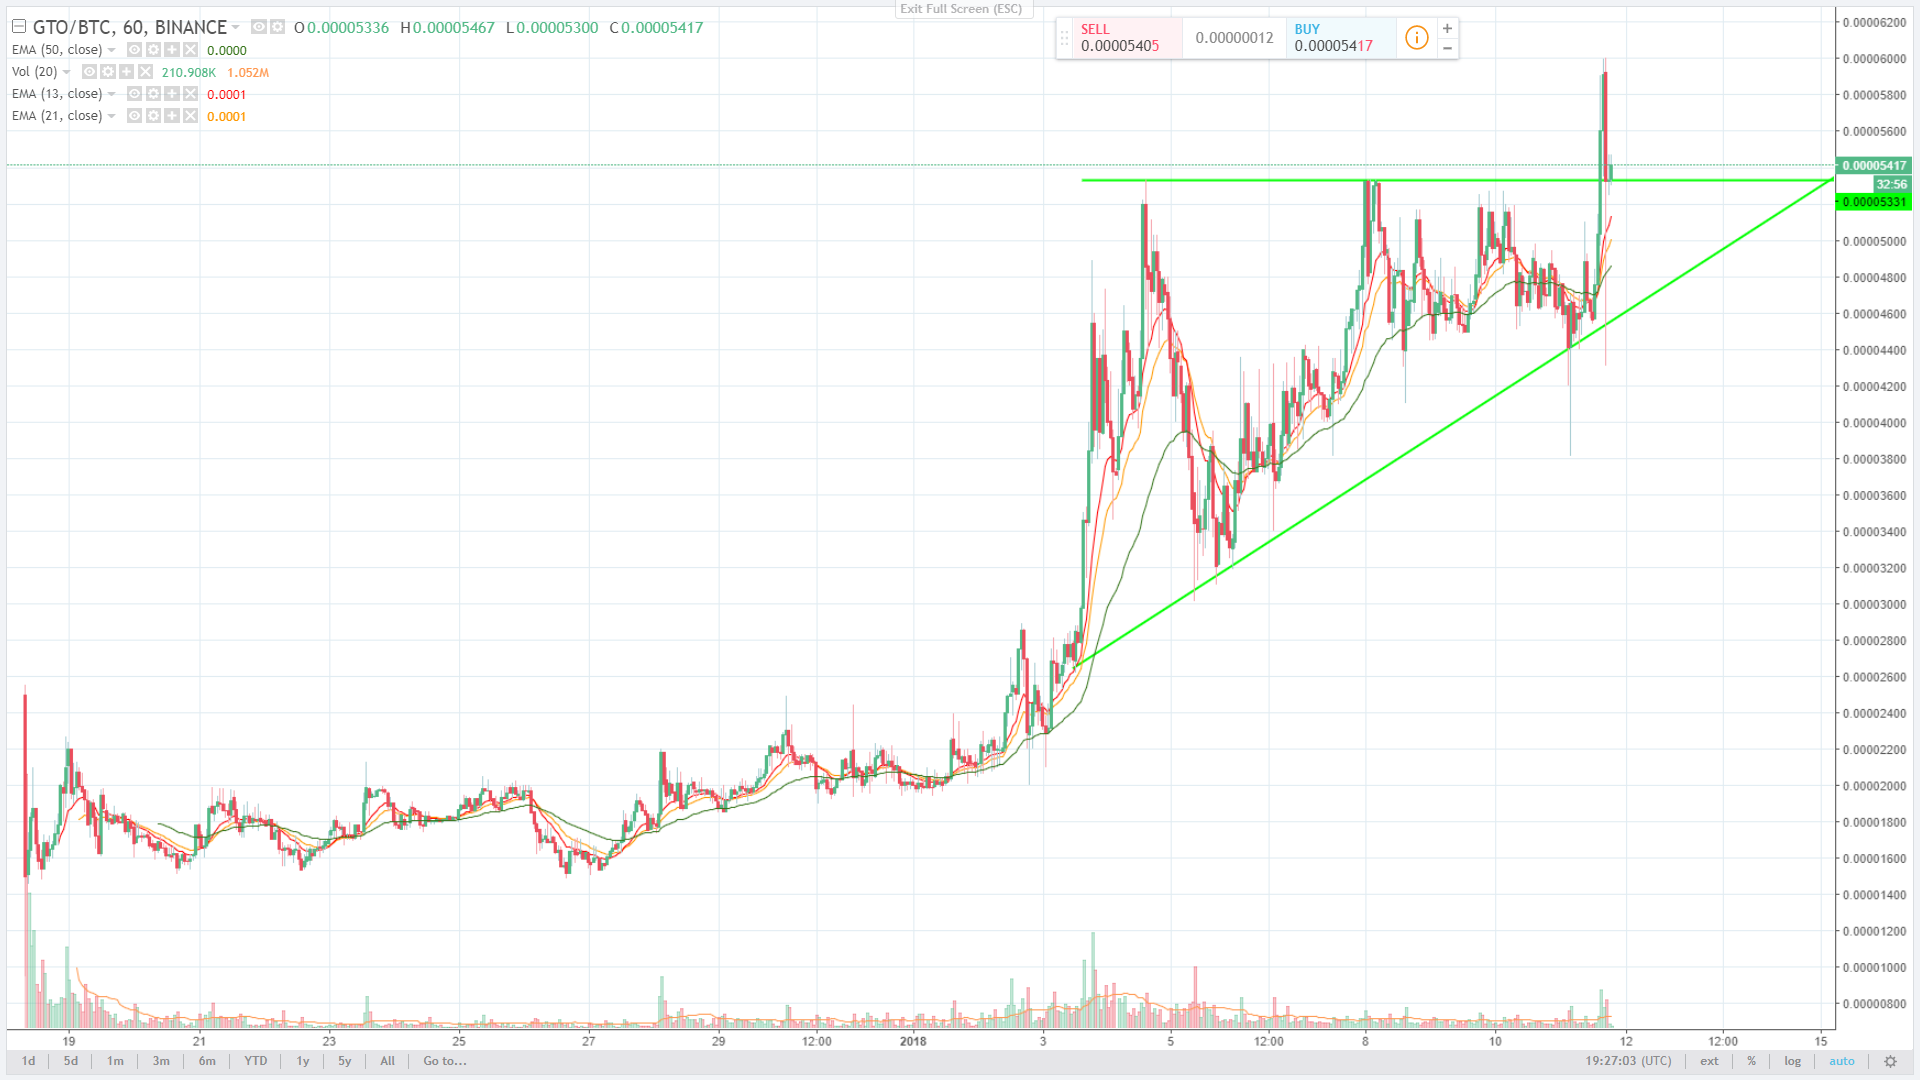
Continuation upward triangle pattern on the 1-hour chart. A big candlestick also showing breaking new highs, with a pullback to the new support/previous resistance level.
I am using TradingView for charting with the Binance exchange pricing.
The EMAs (13,21,50) are also in increasing order.

With the price currently showing the pullback to the new support, this is a high probability trade to continue the trend upwards.
As always, this is not financial investment advice, just my own technical analysis. It's always wise to make your own analysis before making any investment or trading decisions.
Happy trading! :)