2018/06/25 - BTC차트분석 (Bitfinex)
*** 지극히 제 개인적인 견해를 적기에 100% 맹신하지 마시길 바라며... ***
*** 하나의 경우의 수라고 생각해 주시길 바랍니다.. ***
*** 투자 or 매매는 개인(본인)의 분석, 판단과 책임하에 하시길 바랍니다. ***
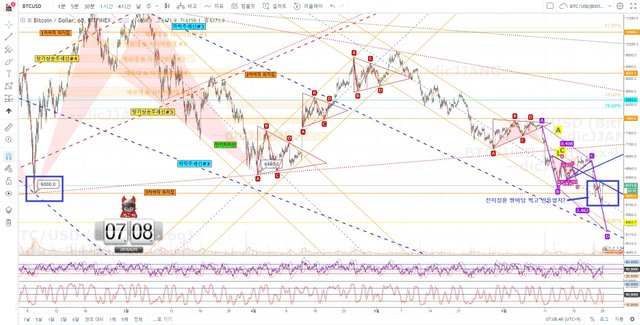
- 1시간봉 차트
2018년 2월 6일날 찍었던 저점인 6000달러 지지선에 바닦을 찍고 반등중입니다.
과연 쌍바닦 패턴을 만들면서 반등을 지속하면서 상승을 할지..
아니면 추가 하락을 할지 지켜봐야 할 상황입니다..
상당히 중요한 시점입니다.

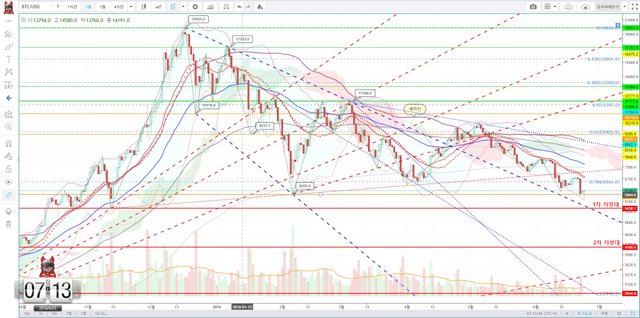
- 일봉 차트
만약 6000달러선에 지지를 못받고 추가하락을 한다면
1차 지지선을 5400달러선
2차 지지선은 4100달러선
3차 지지선은 3000달러선이 될듯합니다.
아래 그림을 보시면 아시겠지만 모든 이평선 아래에 머물고 있고 볼린저밴드도 하락선을 또한번 터치하는 형국입니다.
하지만 보조지표에서는 현재 다이버전스 신호가 나타나고 있는 상태입니다..


Congratulations @dicjjang! You have completed some achievement on Steemit and have been rewarded with new badge(s) :
Click on the badge to view your Board of Honor.
If you no longer want to receive notifications, reply to this comment with the word
STOPDo not miss the last post from @steemitboard!
Participate in the SteemitBoard World Cup Contest!
Collect World Cup badges and win free SBD
Support the Gold Sponsors of the contest: @good-karma and @lukestokes
Downvoting a post can decrease pending rewards and make it less visible. Common reasons:
Submit