original post can be found on my blog http://crocotrading.com/cryptocurrencies/ta-ethereum-review-of-the-last-analysis-and-new-long-term-strategy-scenario/
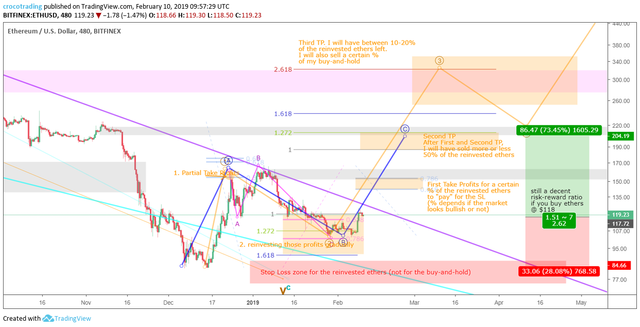
More than four months have passed since my first long term-analysis of ether price action. I have now enough hindsight to make a first assessment. First, I will compare plans made back then with what really happened. This will help us see what has and has not worked. Then, I will develop a new plan based on what was learned previously and on an up-to-date technical analysis.
Last analysis
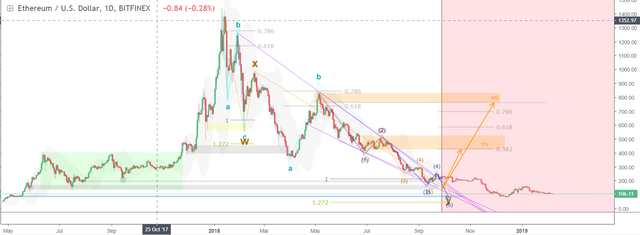
If you don't understand some parts of the chart above, you can find all the details in the previous technical analysis.
Concerning the demand zones, I was expecting a stronger bounce when price reached the $170-$135 grey zone on 12 septembre 2018. We had to wait a long time before reaching the blue demand zone but it did its job perfectly as price moved up after a few days range in the $90 area.
The price action analysis is always more challenging than support and resistance identification. Back in septembre, I thought price was in a C wave shaped as an ending diagonal plotted by the purple lines. I still think price is in the C wave but the ending diagonal wasn't drawn correctly. Since I thought an ending diagonal was going on, the timing of both blue and orange scenarios was wrong but the goal in terms of price was well targeted for the blue scenario.
Looking back now, the part of the last analysis in which I could have done much better is the trading strategy. I was too confident that the market crash was over while the price was still in a downtrend on a daily perspective. Back in septembre, it was probably premature to spend half of the money I had planned for my ether buy-and-hold especially when bitcoin price action was way more bearish. It would have been more wise to go for a swing trade or a mix of buy-and-hold and swing trade with a stop loss for a certain percentage of the total position under the new low made in septembre. The lesson here is to favour the worst case scenario especially when the trade is against the trend (downtrend in this case).
New plan
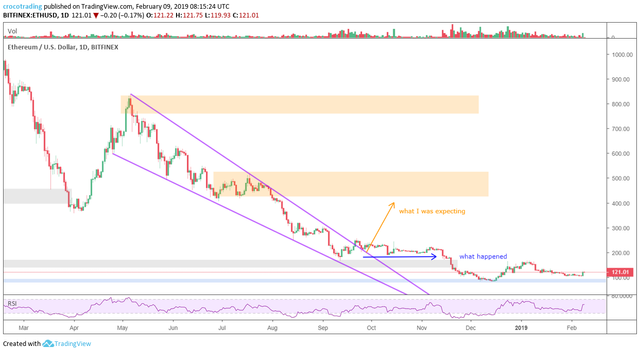
Once price went sideways for weeks ( blue arrow) while my plan was a strong upward move ( orange arrow), I started to question my plan. I couldn't find any relevant patterns on the linear chart, therefore I decided to explore patterns and trend liens on a logarithmic scale which was surprisingly relevant.
Upon reflection, it makes sense to use logarithmic charts for the technical analysis cryptocurrencies. Technical analysis has first been developed based on linear charts of forex and stock markets. As you can see below, most of the time there is not much of a difference between the linear and logarithmic charts of forex and stock markets even on weekly scale. On the contrary, bitcoin and cryptocurrencies price have evolved until now exponentially, moving from bubbles to crashes. Logarithmic scale helps to see details and patterns of exponential moves hidden in linear charts.
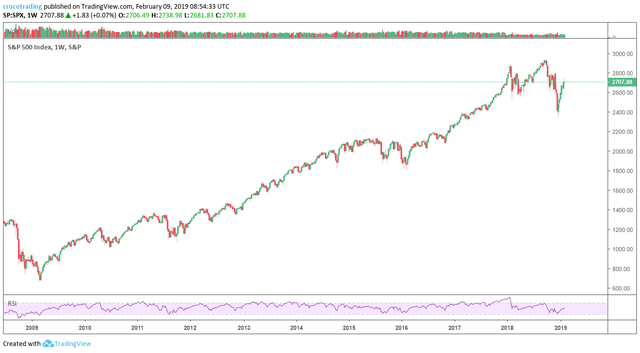
weekly S&P500 log chart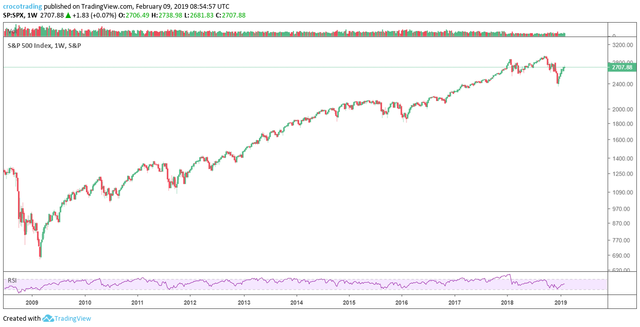
weekly BTC linear chart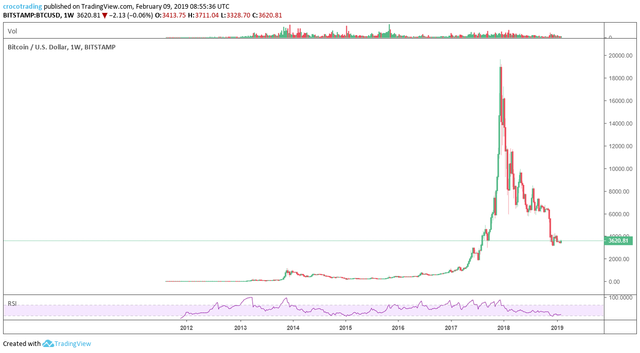
weekly BTC log chart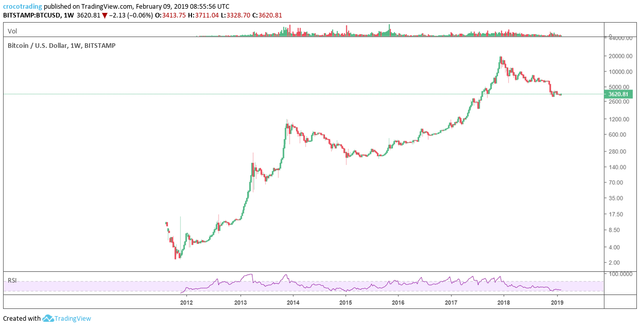
Technical analysis with logarithmic scale
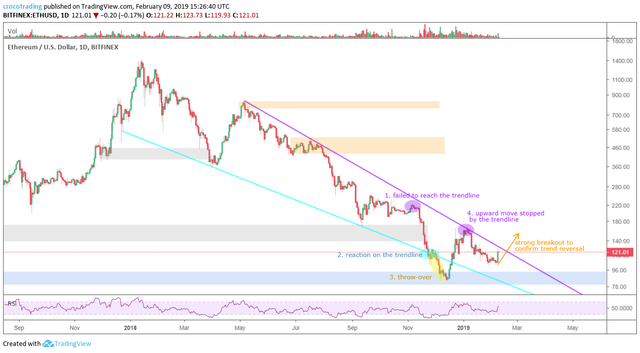
When looking at the daily logarithmic chart of ether, the first thing we notice is that the price has been fluctuating for most of the downtrend between two trend lines. The purple trend line is based on the same pivot points than the upper line of the ending diagonale I had drawn for the last analysis but they do have a very different slopes on the linear and on the logarithmic chart. It seems like the two trend lines are forming a wedge. A vigorous breakout of the wedge would favour the probability of a change in the trend direction.
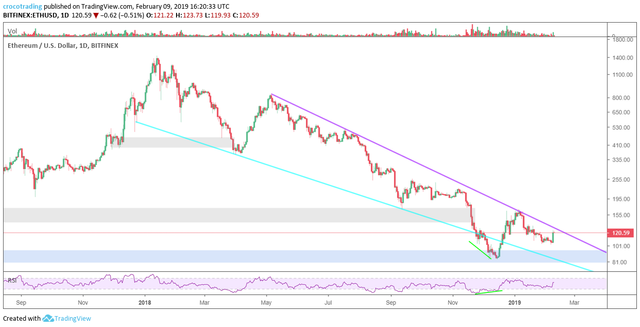
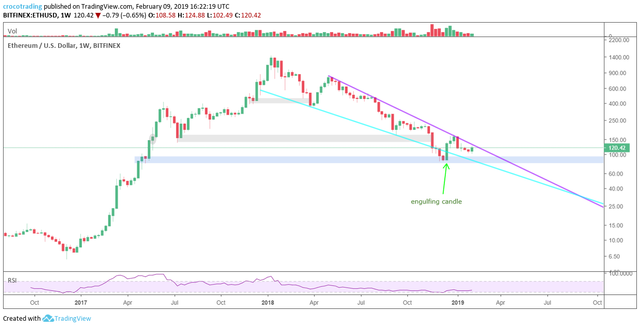
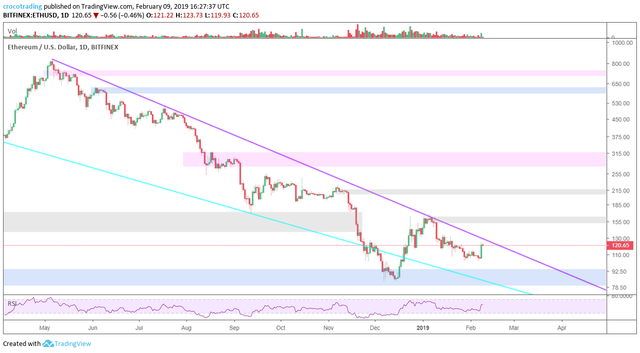
Apart from the wedge, you can notice on the charts below a divergence on the daily time frame , an engulfing on the weekly time frame and new supply zones in pink, blue and grey (with the pink ones being the most important and the grey ones the least).
Daily divergence
Weekly engulfing candle
New supply zones
Price action with Elliott waves
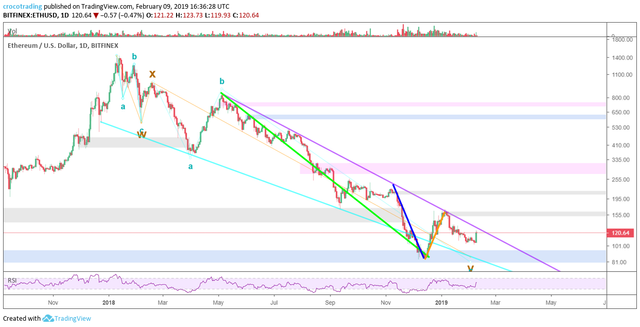
I still think ether is in a huge WXY correction. I am not 100% sure that we have finished it yet. Some people argue that the upward wave we had in December 2018 and January 2019 (thick orange line above) was just the correction of the move represented by the thick blue line but in my opinion, it is too big to be the case. It looks rather like the first subwave of an impulsive wave or some parts of a bigger correction related to the downward move represented by the thick green line.
The three most probable scenarios I can think of based on Elliott waves are drawn below.
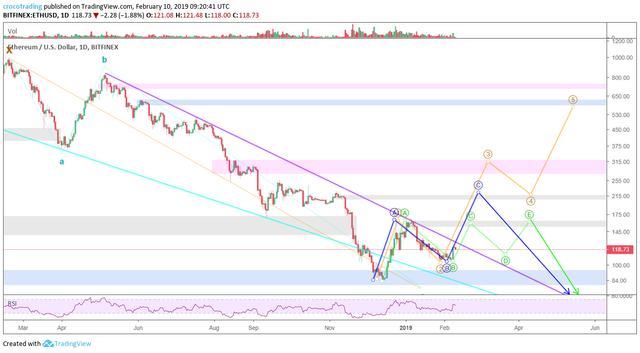
My preferred scenarios are the orange and the blue ones. The orange scenario would imply the end of the big WXY correction and the beginning of a new uptrend. The blue and green scenarios would imply a continuation of the downtrend. In that case, I would probably need to reassess the whole Elliott wave count made until now.
My trading strategy

My trading strategy is closely related to the fact that I have a bullish bias. The bullish bias doesn't mean I am ready to buy any price for ether but rather that I am trying to find the best entry for my longs in terms of risk-reward. I have started to write this article when ether was still worth $106 which was probably the best entry price for longs. Unfortunately for my analysis, it has increased to $118 before I could end the article. However, according to my plan, I think it is still a decent price to buy ethers from a risk-reward perspective. If you want to be more "agressive", you could even set a higher stop loss that the one drawn on the chart above. A stop loss few dollars under the $100 would be totally conceivable.
Website : http://crocotrading.com/
Steemit : https://steemit.com/@focuscrypto
Tradingview : https://www.tradingview.com/u/crocotrading/
Twitter : https://twitter.com/crocotrading
Legal disclaimer : Opinions, markets informations, analyses and any statements made on crocotrading.com website constitute on no account investment advices. The information provided on this website and any accompanying material is for informational purposes only. It should not be considered financial or investment advice of any kind. One should consult with a financial or investment professional to determine what may be best for your individual needs.
@focuscrypto i really appreciate Your effort put in the post, mayby You should promote it a little with good tags, You can learn about tags from the guid i linked in, check me out, i'am upvoting Your post as part of PlanktonGrow program. Would You like to know how You can get more support? how to engage here in more ways? i gather great steem guides, tools on my post here, come see, click my name: @planktongrow.
Downvoting a post can decrease pending rewards and make it less visible. Common reasons:
Submit
This post has received a 4.92 % upvote from @boomerang.
Downvoting a post can decrease pending rewards and make it less visible. Common reasons:
Submit
✅ Enjoy the vote! For more amazing content, please follow @themadcurator for a chance to receive more free votes!
Downvoting a post can decrease pending rewards and make it less visible. Common reasons:
Submit
You got a 12.35% upvote from @dailyupvotes courtesy of @planktongrow!
@dailyupvotes is the only bot with guaranteed ROI of at least 1%
Downvoting a post can decrease pending rewards and make it less visible. Common reasons:
Submit