The Road To Recovery
It seems like the road to recovery is a choppy one this week, with coins bouncing up and down and showing varying degrees of strength of weakness.
The charts (4 hour time frame used today) are still not painting the clearest of pictures at the moment, but I'll try to give an overview of what's happening none the less.
I'll also try to keep this episode as short as possible, let's get stuck in!
Bitcoin
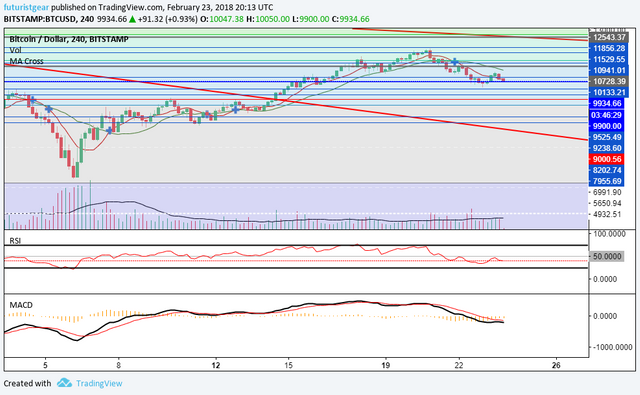
Bitcoin continues to look weak on the 4 hour charts, but remains neutral on the daily chart.
- The RSI is below 50 still here, but
- The MACD could turn bullish if the bulls gain strength.
- Another positive can be found at the $9500 support level, which hasn't been breached despite another pullback.
Summary
Continue to watch that $9500 support, below that further support is found at $9200 and $9000.
If the bulls can regain control, look for the $10,100, and $11,000(ish) areas for resistance.
Ethereum
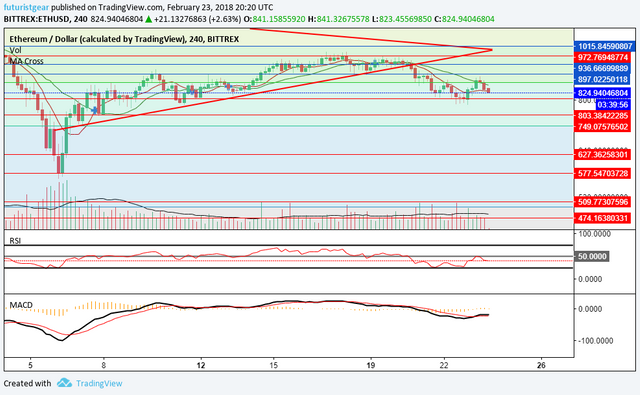
Ethereum gained some of short term strength back and looked like it might try to pierce the $900 resistance level at one point, but it failed.
*The RSI is back below 50 &
- The MACD looks as though it might return to the bearish side.
ETH still looks weak on the daily too, and the downtrend is still clearly intact here, so some further downwards movement and/or sideways action could be on the cards.
Support is found at $800, and $750. If the bulls can take charge, resistance is ahead at $900.
Ripple
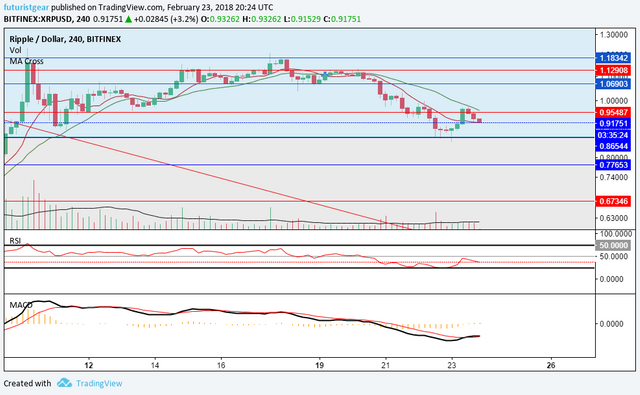
Ripple managed to hold above its $0.86 support for the most part during the sell-off, but it still looks weak on both time frames despite the fact its MACD looking bullish on both charts.
I think XRP looks very much like it's in for more sideways action at the least, with that $0.86 the main focus if it turns more bearish. Below that, the 77c support area could be tested if further selling happens.
Should the bulls regain the strength that has gone missing, $0.95 and $1.06 levels offer resistance that will need to be overcome.
Bitcoin Cash
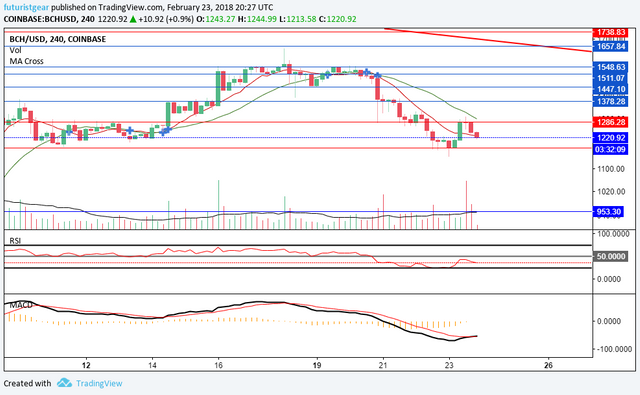
The chart for Bitcoin Cash looks pretty damn similar to that of Ripple, meaning BCH could follow a similar pattern.
The nearest key support, which has held so far, is found at about $1180 with the next major levels found at about $1025 & $953.
Resistance is at $1280, $1370 and about $1440 if the bulls can regain their strength.
Litecoin
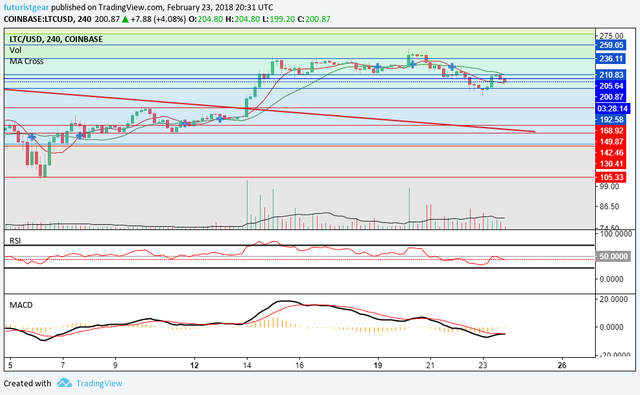
Litecoin continues to look the strongest on the Daily chart, but the 4 hour time frame remains neutral to slightly bearish.
Litecoin needs a shorter term boost in order to break any further resistance areas, those are found at: $210, $236 and $260.
If it were to turn more in favor of the bears, look for $192, and also $168 to hold.
Cardano
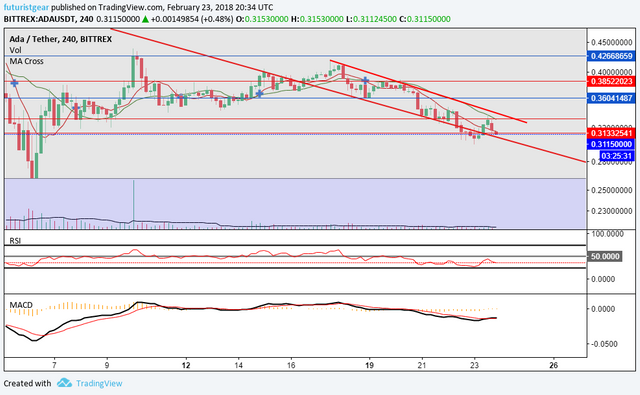
ADA continues to look one of the weakest coins in the top 10, and it has been flirting with moving back beneath its prior downtrend line, although it is currently on the right side of it at the moment.
If it remains as weak as it is now, then then next areas of support are at an area between $0.28 <-> $0.30, and another support level at $0.26.
Stellar
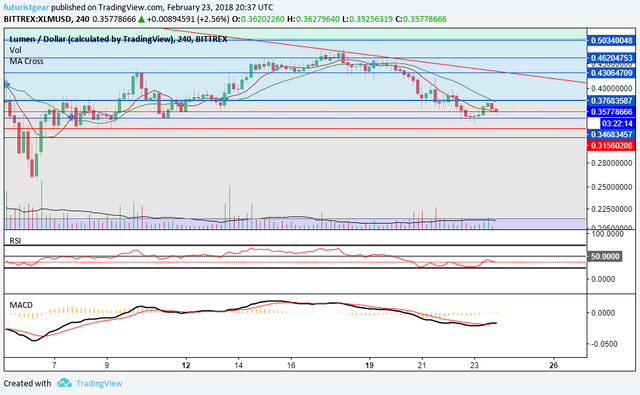
XLM (or STR if you're on Poloniex) looks pretty similar to ADA and it continues to drift too.
Stellar failed to breach resistance at about $0.37 and may now test the support at $0.35 once again unless it gain strength. Below that, should it get breached, there is more support found at $0.33 and $0.31.
If the bulls decide to take control once again, and the $0.37 can be broken, then further resistance is found at about $0.40 and also the downtrend line that remains in play.
NEO
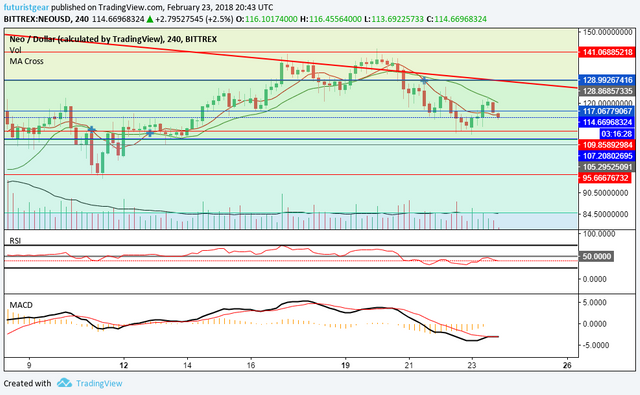
NEO found support at around the $110 once again during the selling, but it still looks weak on the 4 hour chart. That said, it's one of the more neutral coins when viewed on the daily time frame, so it might hold up a little better than some of the weaker coins should the selling resume.
There are 3 support levels all very near to each other at $110, $107 and $105 that could help prop it up should the bears come back, followed by the $95 level.
If the strength shown on the daily chart can be transfered more towards the shorter term, then weak resistance is ahead at $123, and also the downtrend line.
EOS
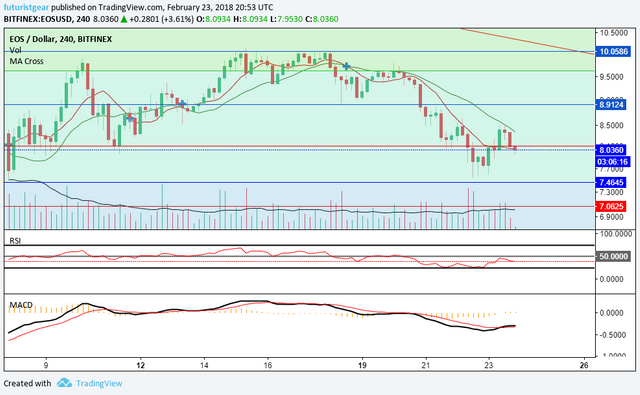
EOS is trading right around the support/resistance level of about $8.10 as I type, and it remains mixed to slightly bearish on both timeframes.
Weak support is found between $7.75 with more support at $7.50 and the $7 level. If the bulls can take over, the $9 area is the next major hurdle.
DASH
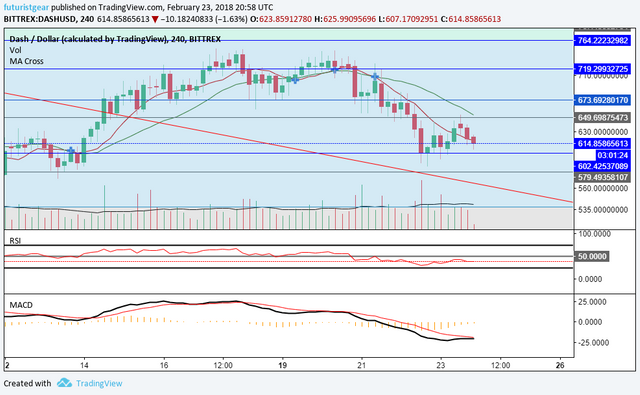
Dash maintains the #10 spot, but it still looks weak to neutral on both time frames, and support has been used at the $600 level. Beyond that, more can be found at about $580 and $540 should it need it.
If the bulls can regain control, $650 and $675 provide areas of resistance ahead.
Summary
Overall, the market continues to look very mixed from a technical perspective. Sideways action looks the most likely course at the moment, or maybe even more pullback if the strength weakens.
Some good news for any of the top 10 could always propel prices in the upwardly direction though, so keep your eyes and ears open for anything that could start a fresh rally higher.
Any thoughts on the market currently? Let me know below!
Thanks for viewing!
Want more technical analysis and crypto related posts? See also: @toofasteddie, @gazur, @ew-and-patterns, @pawsdog, @cryptomagic, @exxodus, @beiker, @lordoftruth, @masterthematrix, @cryptoheads, @tombort, @maarnio, @steemaze & @briggsy
Not intended as investment, financial, or trading advice. For entertainment purposes only.
Very good analysis! I'm completely agree with that! I was doing today few of them and my opinion its very close to yours! Keep Trading!
Downvoting a post can decrease pending rewards and make it less visible. Common reasons:
Submit
Good to know @cryptoforexhunt, thanks for your comment! :-D
Downvoting a post can decrease pending rewards and make it less visible. Common reasons:
Submit