The price of Litecoin at the time of writing is $69.41. with an All Time High of $412.96 occurring on May 10 2021 and an All Time Low of $1.11 on January 15, 2015.
Litecoin is an open-source payment system with blockchain technology which is a peer-to-peer Internet currency that enables instant, near-zero cost payments to anyone in the world.
If we look at the current Bitcoin and Litecoin price charts, they are very different because Bitcoin is in a strong bullish sentiment, while Litecoin tends to move in a range. At the time of writing Litecoin ranks at 20 on Coinmarketcap
LTCUSD technical analysis

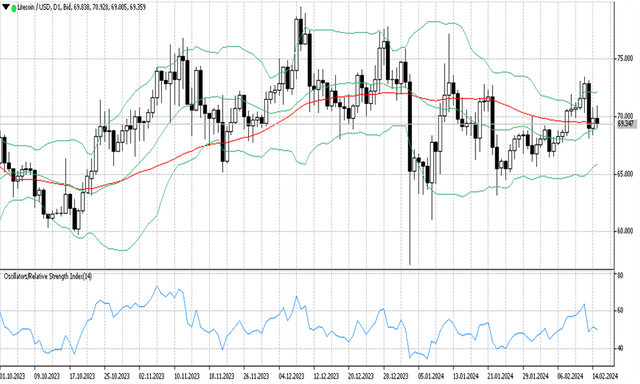
LTCUSD price moves near the middle band line in the $69 range, this forms a bearish candlestick with long shadows on the top and bottom candle, closer to Doji which can be said to be a market indecision candlestick.
LTCUSD had a record high at $73,457 on February 12, and moved down to $68,114 on February 13. The Bollinger band here seems to tend to be a dynamic support and resistance zone with a price range of 65-75.
MA 50, which measures the average price for the past 50 days, forms a flat channel near the price indicating a sideways market
The RSI indicator shows level 50 which means the price is moving in the neutral zone.

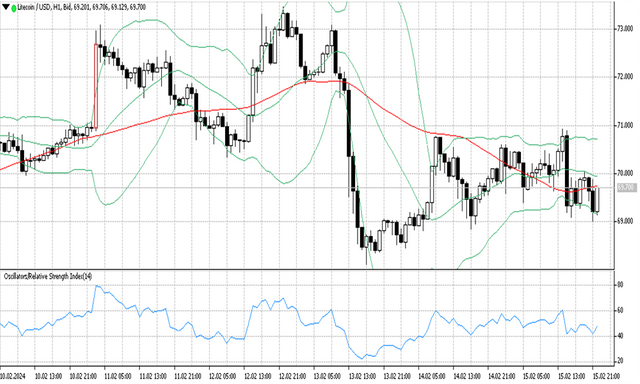
In the H1 timeframe for day trading, LTCUSD is now moving near the lower band line. Here the Bollinger bands form a flat channel with a fairly wide band spacing, an indication that the market is moving in a range with medium market volatility.
MA 50, which measures the moving average for the past 50 hours, forms a flat channel near the price below the middle band line, an indication of a sideways trend with weak momentum.