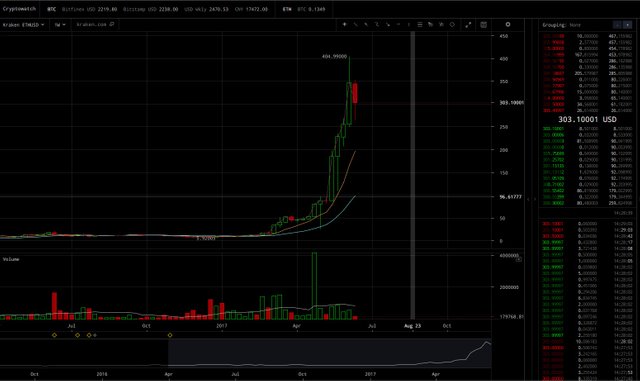

GWOAH! Look at that uptrend on the weekly chart. A thing to behold. So the weekly candle of June 7th- 14th closed around $351, about $50 dollars down from the high leaving that wick that scared the normies back into their safe spaces. When any candle closes like that, far away from the simple moving averages, the next candle typically goes down and then comes back up and potentially can go higher than the last. What I like is that the current weeks candle has already come down to $260 on the 1st day of the new week. Giving us the rest of the week to get that candle to have strength and potentially break out of the high of $404.
On the other hand, things are getting far away from the moving averages. The best thing to happen would be that price stays where its at for a few weeks to months and catch up to the 20 SMA and blast off to $600 +. ETH is a different beast that doesn't play by the rules of traditional trading. It just goes up and breaks records.

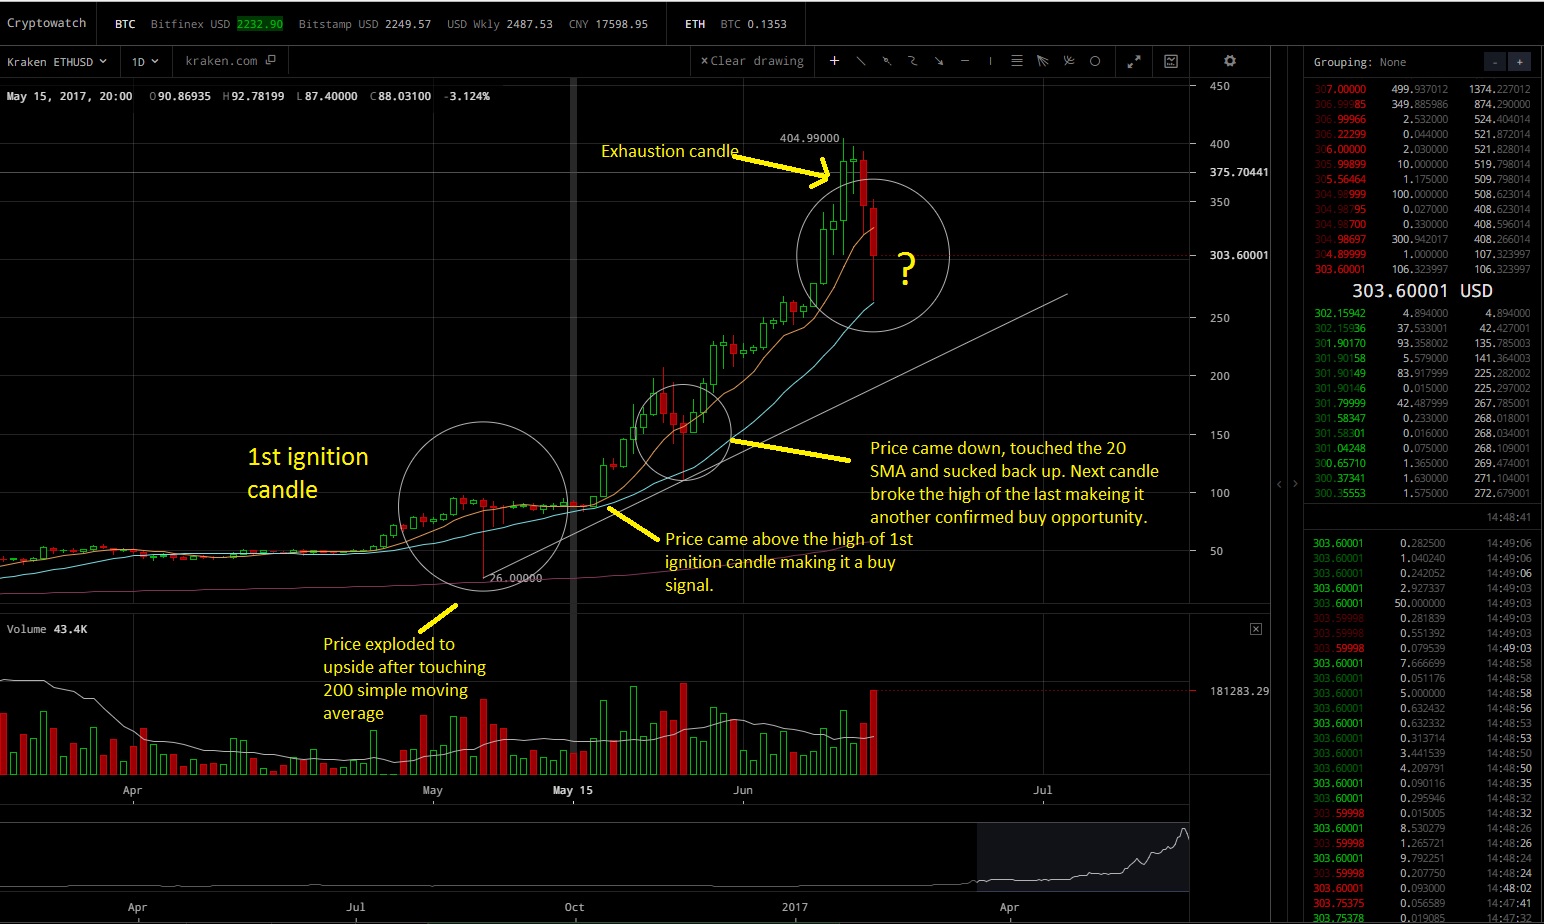
Here is a daily chart of ETH. I circled the 1st ignition candle, the candle that started it all. We also call that a elephant bar because no matter how much governments, financial institution or "whales" would like to hide their actions from us, they always leave a footprint in the market when they put large amounts of money up. That big ol' elephant leaves a footprint. Its our job to follow those footprints. Follow the money flow. So after that 1st ignition candle, price went sideways for 12 days before price went up to break the high of that ignition candle. You have to wait for follow through and that would be your entry.
On the middle circle, price came down to the 20SMA (blue line), sucked right back up, closed as a bottoming tail in an uptrend, creating a higher low and got the entry signal the next day as as price broke the high of the previous candle. Another nice entry.
Notice how I pointed out the exhaustion candle, whenever you get big candles at the end of a trend that are far away from the simple moving averages , trade with caution. We trade big candles that start AT the moving average not far away from the moving averages. Technically it was touching the 8SMA and really not that far away from the 20SMA but it was certainly far away from the 200SMA.
So what happens here at the 3rd circle? Price came down, touched the 20SMA and at this moment, already the buyers are coming in. We are still in a very bullish uptrend, we have seen how price reacts when it touches the 20SMA, it goes up. It will be interesting to see how this daily candle closes. If the candle closes as a bottoming tail like the ones I circled before and we get follow through when the candle breaks the high of that bottoming tail, then we could be going to retest the high of $404 and if that breaks out then its on to $500. Remember the whole numbers are like a magnet.
All in all things are still very bullish, buy on the dips or hold through the pullbacks to the simple moving averages. Ethereum and all cryptos are going to transform the world and I'm happy to share this experience with you all.
- Your boy, Conor McTrumper a Forex trader with over 20,000 hours experience.
Let the market come to you!
Downvoting a post can decrease pending rewards and make it less visible. Common reasons:
Submit
Yeah, very bullish! More ICOs coming up next week
Downvoting a post can decrease pending rewards and make it less visible. Common reasons:
Submit