BTC/USD update
7 years ago by srezz (48)
$0.51
- Past Payouts $0.51
- - Author $0.40
- - Curators $0.11
23 votes
- + norwegianviking: $0.464 (100%)
- + gtapps: $0.004 (100%)
- + z0rn: $0.004 (100%)
- + crazind: $0.004 (100%)
- + sh1v13: $0.003 (100%)
- + tangkp: $0.002 (100%)
- + easyg: $0.002 (100%)
- + devenderyadv: $0.002 (100%)
- + bhumulas: $0.002 (100%)
- + jeremija01: $0.002 (100%)
- + persona: $0.002 (100%)
- + longcrypto: $0.002 (100%)
- + bsbeers: $0.002 (100%)
- + cogitoergosum1: $0.002 (100%)
- + midoz: $0.002 (100%)
- + mikedc: $0.002 (100%)
- + trooper.cof: $0.002 (100%)
- + piccolobonzo: $0.002 (100%)
- + diehazard: $0.002 (100%)
- + cristianbroke: $0.002 (100%)
- … and 3 more

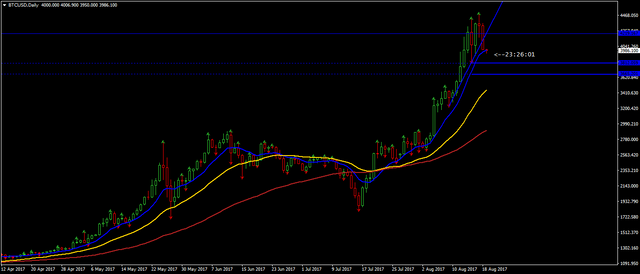
Do you see this as wave y for btc and bold blue line as the tip before it comes down to the dotted blue. Please advise.
Downvoting a post can decrease pending rewards and make it less visible. Common reasons:
Submit
Once the price closed below the bold blue line the blue dotted lines show high probability targets where the market should be held and bounced from. I don't expect any significant bounce. What it will produce though is a new level of daily volatility and therefore new targets.
In terms of EW there are too many variations at this point of time that the entire exercise turns into a form of guessing.
Downvoting a post can decrease pending rewards and make it less visible. Common reasons:
Submit
Thank you, very thoughtful.
Downvoting a post can decrease pending rewards and make it less visible. Common reasons:
Submit