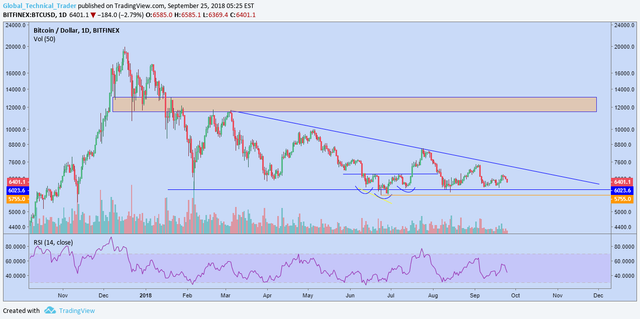
Since Bitcoin found support around 6k in February after breaking the parabolic run up to 20k, it has been trading in an increasingly tight range, forming a descending triangle. Whilst typically described as a bearish chart pattern, it can in fact break in either direction and price is fast appraising the apex of the triangle suggesting a move is imminent.
It has tested the lower bound of support a number of times so should buyers finally give up, expect a swift decline with a target of ~3k. The line in the sand to watch here is a move below the June low at 5,755.
However, should price break above the downtrend line, representing a marked shift in sentiment, I would be targeting the beginning of the descending triangle around 11,500. Significant resistance exists at this level and would leave open the possibility of more sideways action from there.
Only once price has cleared 13k can we even consider a move back up toward the Dec '17 highs.
whhat do you think, 13K will be reached in short time?
Downvoting a post can decrease pending rewards and make it less visible. Common reasons:
Submit
Price could still break in either direction. 11.5k is the first target only if price conclusively breaks the downtrend.
Downvoting a post can decrease pending rewards and make it less visible. Common reasons:
Submit
yeah, agree!
Downvoting a post can decrease pending rewards and make it less visible. Common reasons:
Submit