Hey guys. First post of this account. Will be doing more charts in the future.
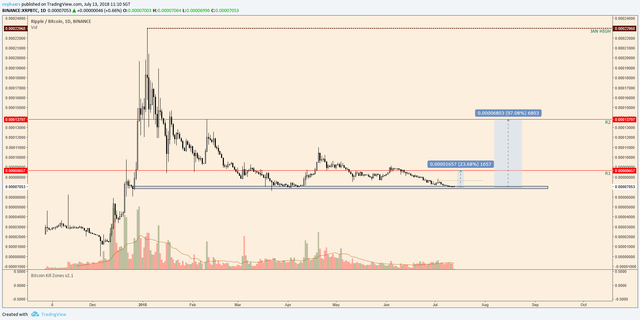
Today, we'll be looking at XRP/BTC chart. We can see that blue box which is the major support and accumulation zone for XRP.

Red lines indicate resistance. Now till R1, we have a 23% gain. After that, R2 is a 97% gain from here on.
Thus, it is not a bad idea to go long here on XRP.
✅ @the-ema-guy, I gave you an upvote on your post! Please give me a follow and I will give you a follow in return and possible future votes!
Thank you in advance!
Downvoting a post can decrease pending rewards and make it less visible. Common reasons:
Submit