The following is a repost of an article posted on Medium this last weekend:
In my first article on Medium, “Did the Crypto Bubble Just Pop?”, I described how the crypto market had a very bullish set up*. However in my second article, “What’s Next for Cryptos”, I argued that those setups had broken down. I gave a few targets as shown below.
Today, we are tracking those same bullish set ups all over again. We call it the 1–2 setup on the Elliott Wave Trader, noting a five-wave pattern that comprises a larger wave 1, and a three-wave corrective pattern for wave 2. These setups project a potential larger five-wave fractal with a third of that pattern coming soon.
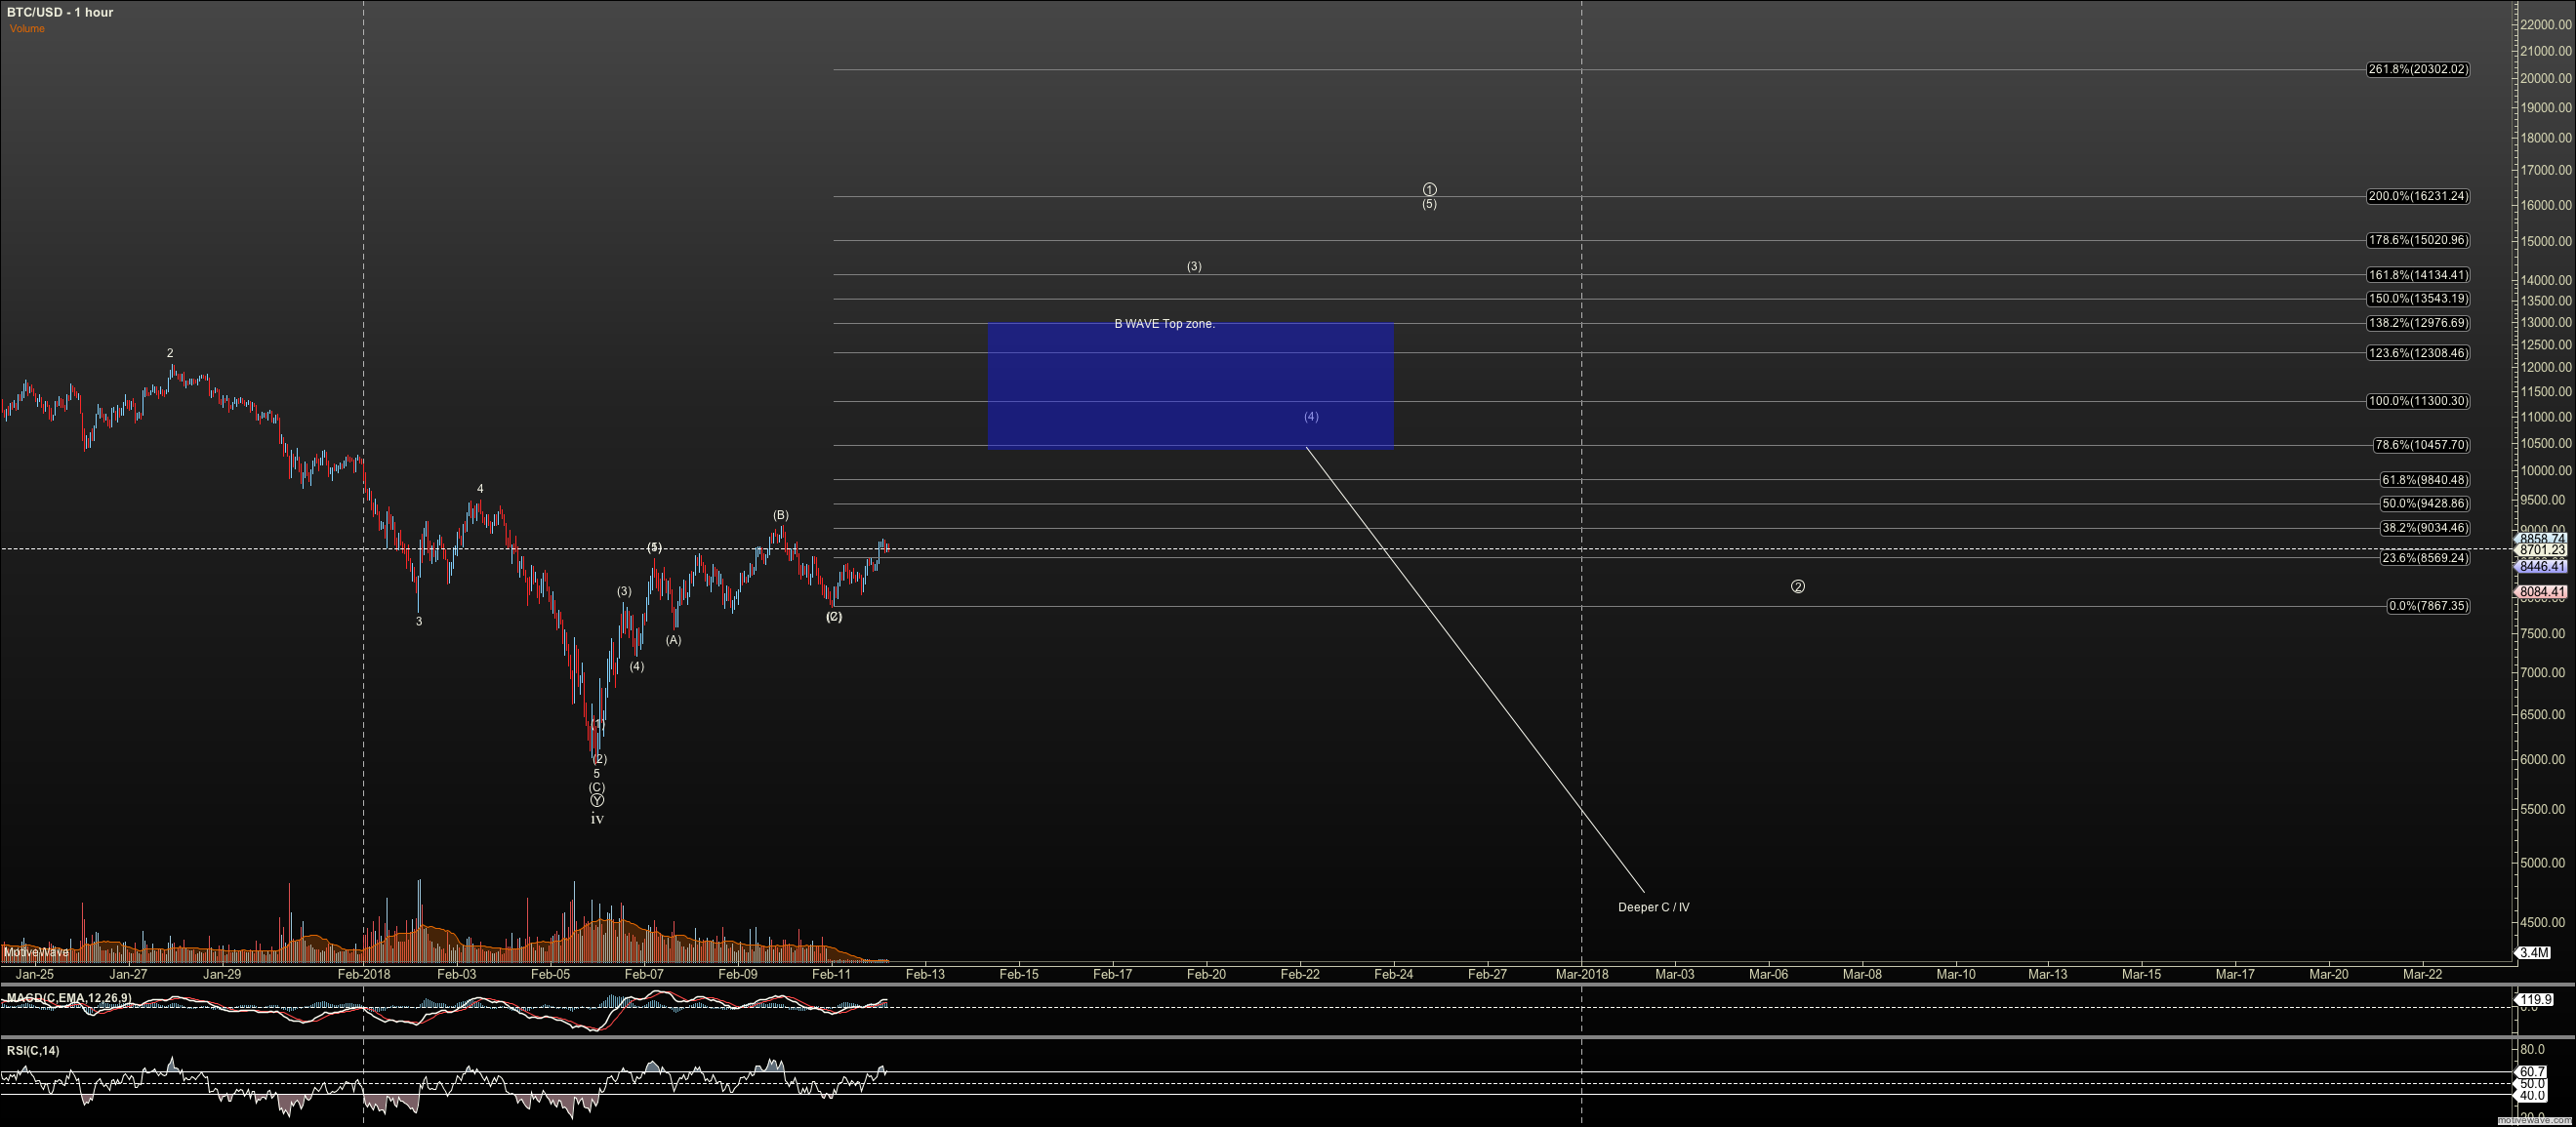
Let’s review a couple of key charts to see where we’re potentially going. Bitcoin, of course, is the main bellwether for the entire crypto market, so it is the most important. We see a potential bottom in the $5,900 region (depending on the exchange) and it has filled a five-wave pattern up to $9,090. After that high, last week it consolidated in a potential wave 2 decline, as shown on the chart.
Using our Fibonacci method, we can project the potential next degree five-wave pattern will increase to $16,230. However as always I’m looking in the $12,975 region for another potential B wave. This is marked on the chart below with the blue box. We’ll take off some profit in that blue zone in case it breaks down. If the full five-wave pattern plays out, we can expect a corrective* retrace that could set us up for the $30K region, and even on to $65K
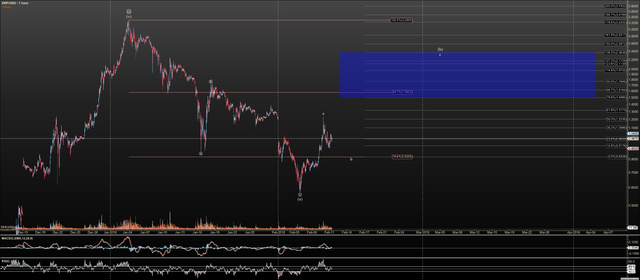
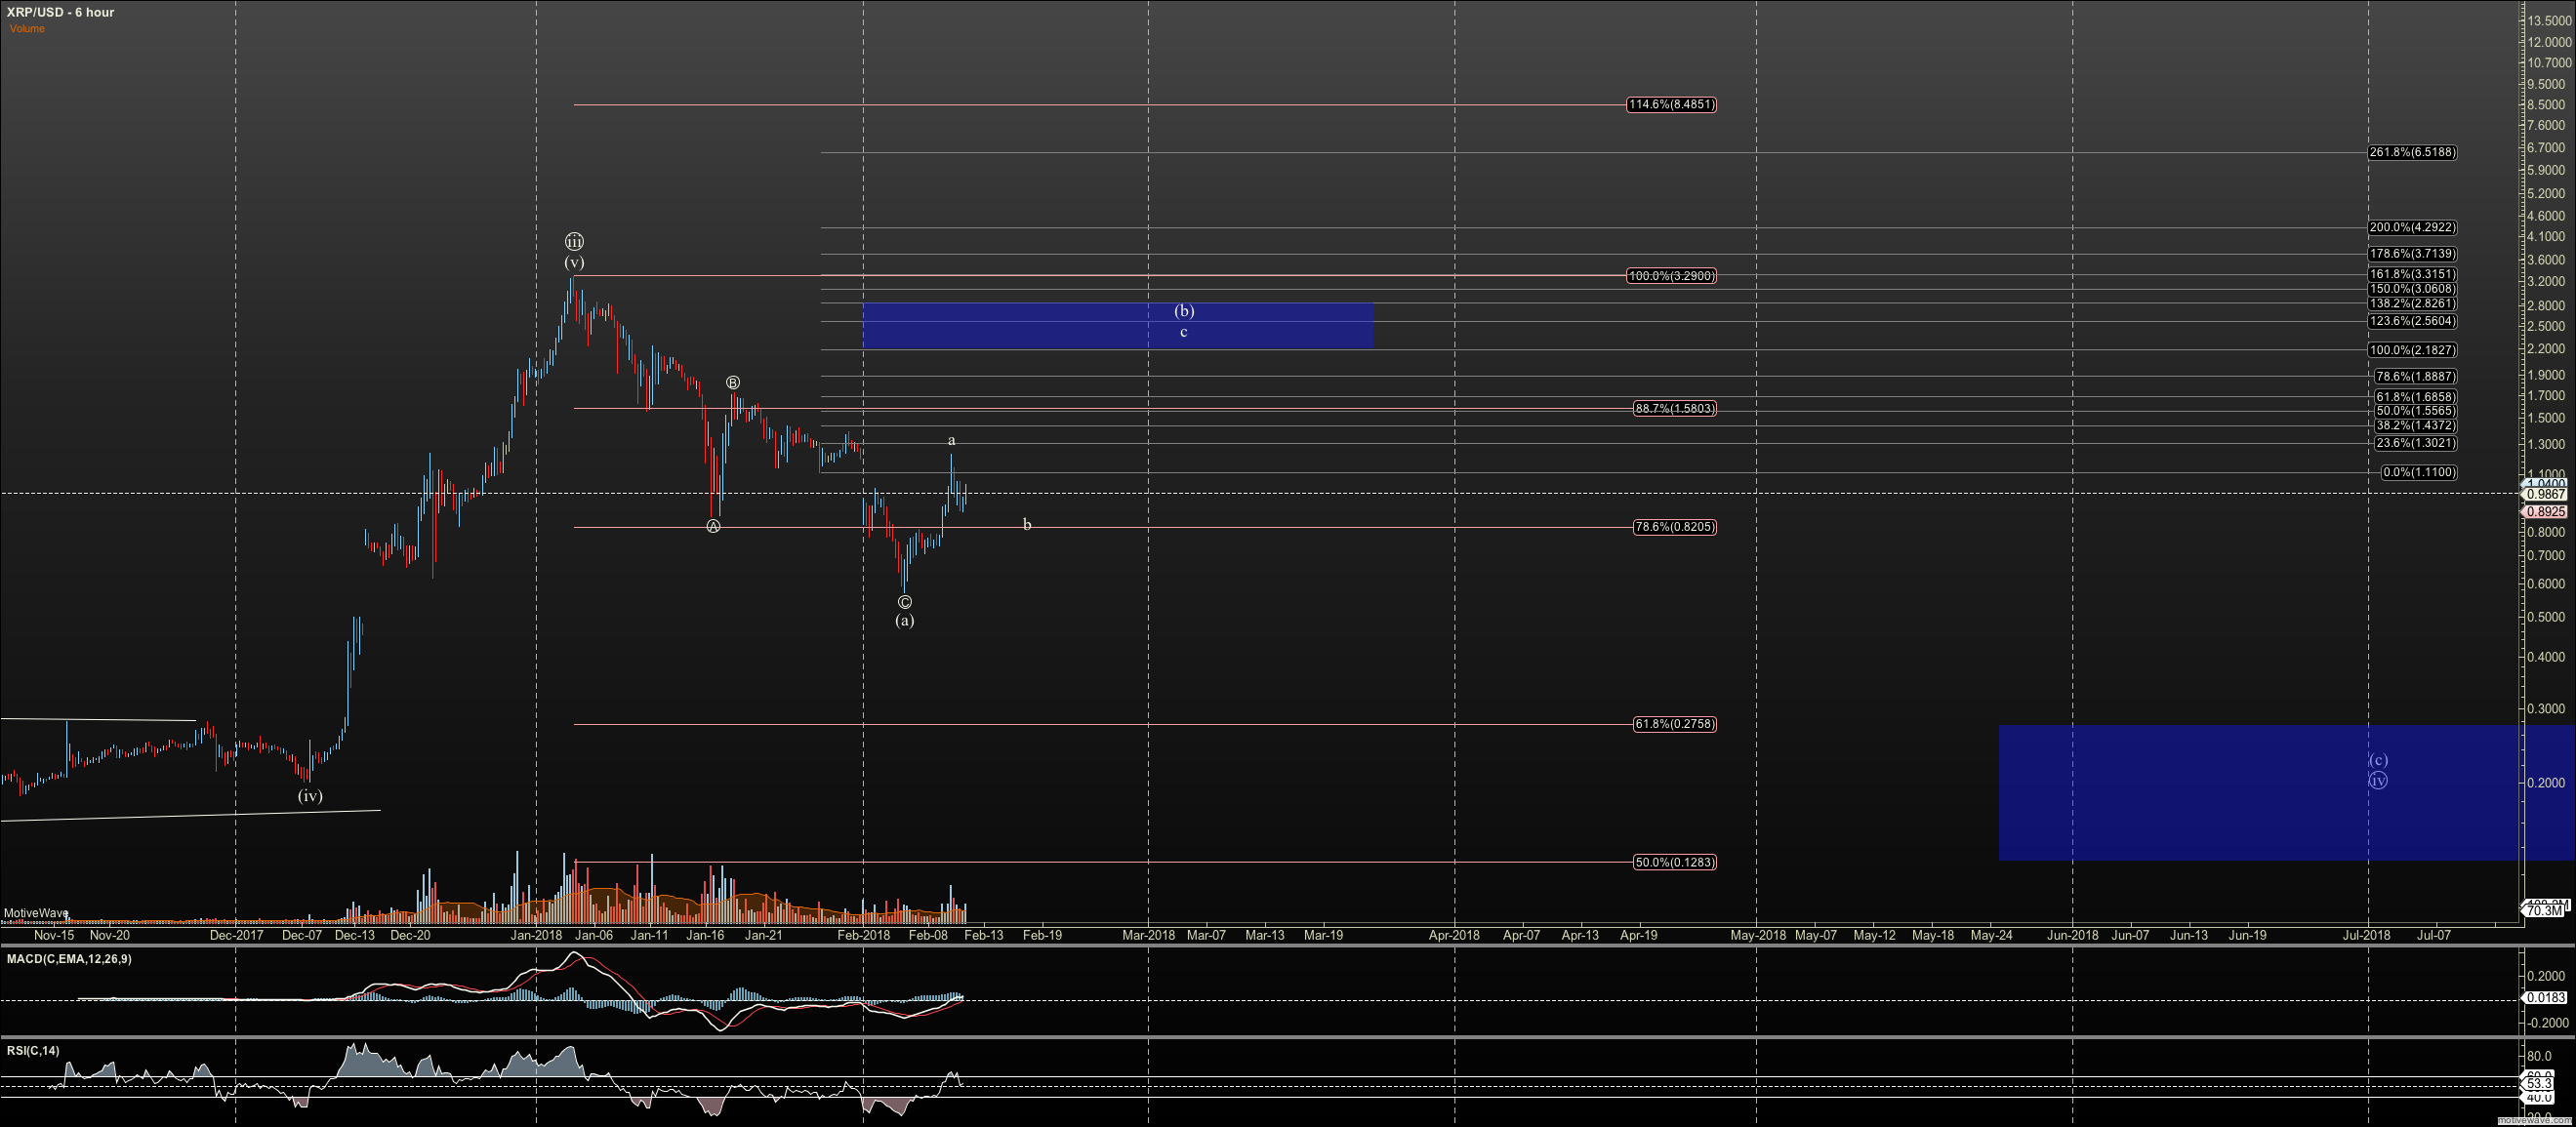
The troublemaker in the last drop was Ripple, as it broke a key support for another fifth wave on our daily chart. It did so in the last leg of the drop. Unfortunately, now our preferred calculation is that Ripple had a higher degree third-wave top and should drop to the 25 cent region in a C wave. Therefore, we expect the current configuration to provide a B-wave top in the $1.50 to $2.40 zone.
However, if instead Ripple forms a very clean five-wave pattern as described for Bitcoin, we can expect to it be much higher, into the $3-$4 range before a major top. The two images show a close-in view of Ripple and a zoomed-out view of the daily chart.
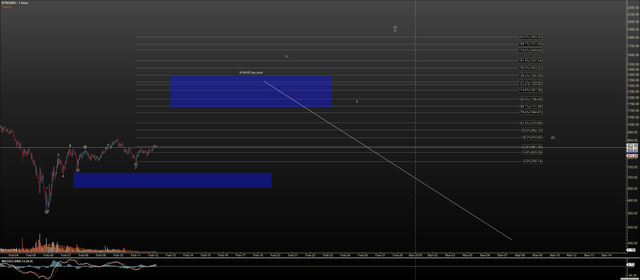
Ethereum has a five-wave pattern as wave 1, through $858. And it has followed a very bullish pattern called a “running flat” to $780. This pattern sets Ethereum up for a potential run to $1,800 and eventually on to the $3,000 to $3,500 region where we expect a major top. However, we do have similar B wave resistance up to $1,390.
.png)
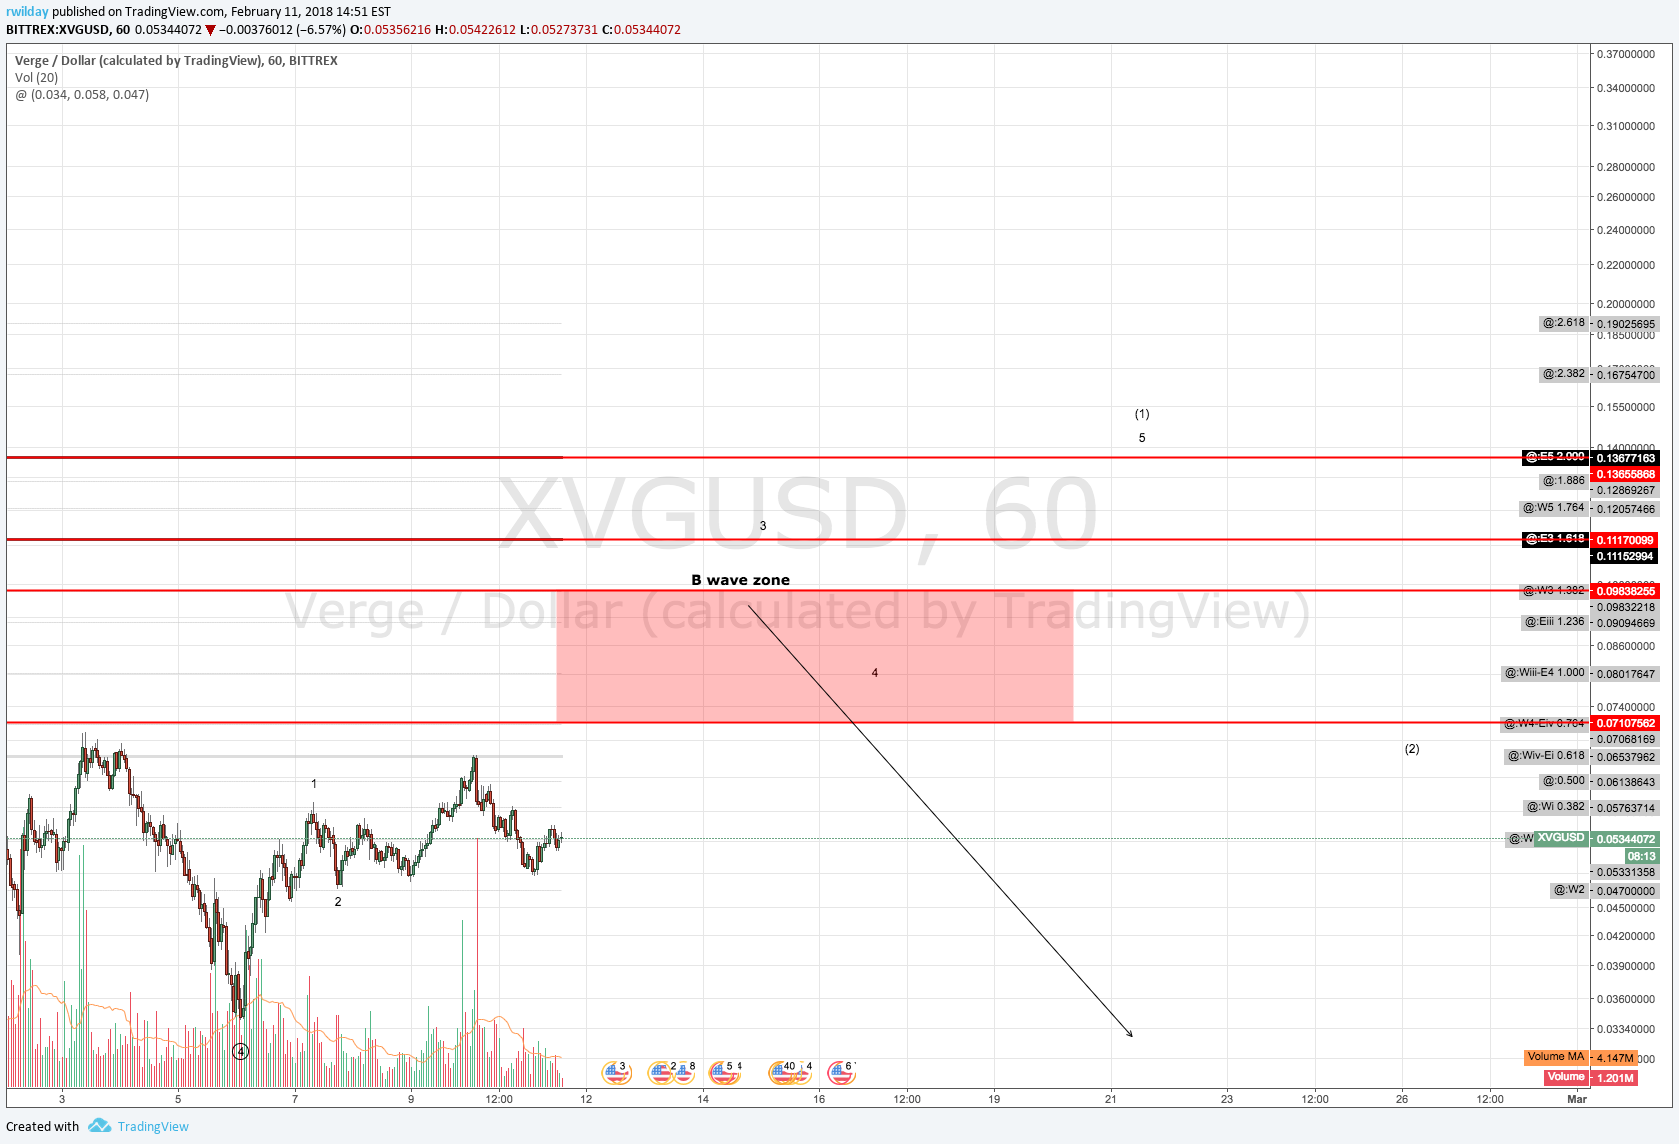
One of our favorite altcoins is Verge. My tweets on Verge have gotten a bit of a following on Twitter, as I called for the $13 region to be seen this year based on Fibonacci projections. We have a very complete correction in Verge now, provided we complete the five-wave pattern shown, up to $.136, and we can reasonably expect a rally to 80 cents with the possibility of seeing $1.75. We don’t expect to see a rally to $13 start until there is a strong retrace from that region.
In conclusion, it appears that the crypto market is again set up to rally. With the exception of Ripple and a few other cryptos that broke down, we expect another bullish wave. However the market has more work to do to eliminate resistance and complete bullish five-wave patterns before it can run free. Trading the market is just a game of probability. So, at any given time a key point or points of resistance could start to thwart a move higher. If so, we’ll be ready.
*Notes/Glossary:
The term ‘setup’ is an industry term that describes a price formation that pertains to a certain outcome. In this article I am referring to bullish ‘setups’.
‘Corrective’ is a term used by Elliott Wave Technicians to describe a pattern that is overlapping in structure so it covers little distance. This occurs in short countertrend moves.
‘Retrace’ is a word in trading that describes when price moves back on the previous move.
In combo, the phrase ‘corrective retrace‘ suggests a countertrend move that is weak in structure so the market is most likely to move back toward the main trend at some point.
For me, this has been very informative. Although I have no idea how you and other traders are able to calculate Fibonacci projections. Do you use it the same way in a downtrend as in an uptrend?
Downvoting a post can decrease pending rewards and make it less visible. Common reasons:
Submit
It's complicated actually. On EWT, we teach fibonacci projections in the context of Elliott Wave. (I was once a paid member but was brought on staff to lead the crypto trade room). Each wave has a relationship to each other and we use those relationships to validate our count. And, if our count proves accurate, we can tell where the market is likely to turn ahead of time. Or, where we need to stop out of our trade. RN Elliott didn't put such strict rules on his theory but talked about some tendencies. We lock it down. Further, most platforms calculate in linear. Fortunately Motive Wave the software calculates fibs in log when you set the chart to log. Kind members on the site with a little help from me, created a log fib tool for trading view which we circulate to members.
Downvoting a post can decrease pending rewards and make it less visible. Common reasons:
Submit
Ok. Thank you for explaining it in more depth and opening my limited understanding of trading. Thus far, I only know how to read RSI, MACD, and the Moving Averages. My capability of using the Fib tool is very limited and the Elliot Wave was something that I could not make any sense of lol
I appreciate you taking time to go write back, slowly slowly I'm getting a sense of what I need to learn before I can start trading :)
Downvoting a post can decrease pending rewards and make it less visible. Common reasons:
Submit
The best school for trading is putting money in the market. It accelerates your learning. But best to just stat with very little money. Money you don't care about. With cryptos you can trade with $5. Whether you grow it or lose it, you learn faster.
Downvoting a post can decrease pending rewards and make it less visible. Common reasons:
Submit
So do u think we are still headed for a lower low this year based on the charts in the past week?
Downvoting a post can decrease pending rewards and make it less visible. Common reasons:
Submit