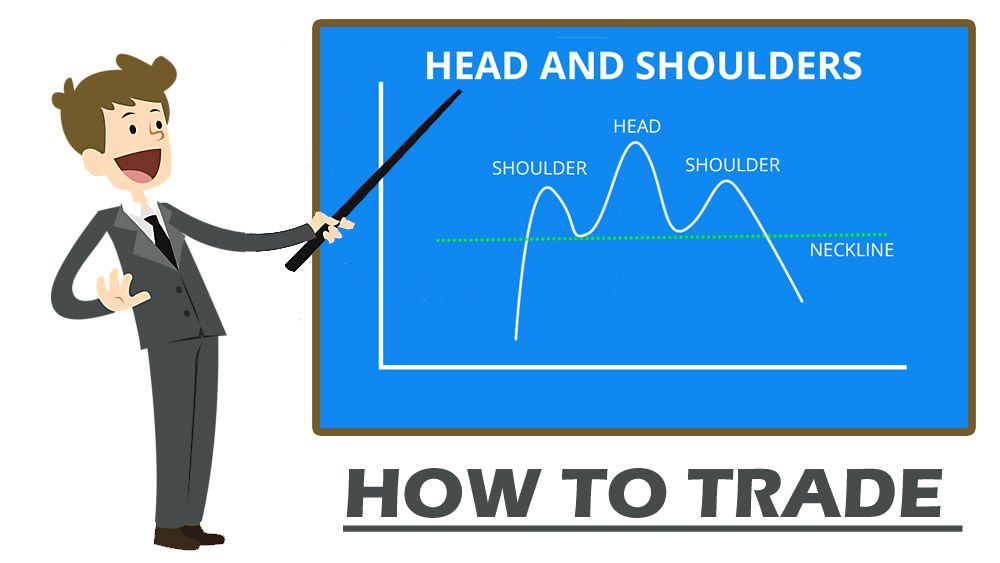
Chart patterns; you probably have heard of them but recognizing them can be hard sometimes. They are more than just shapes which happen to form in the price movement of an asset. Chart patterns can be powerful when understood correctly. Namely, they don’t form randomly, but are formed due to supply and demand dynamics and decisions traders take in certain situations.
In this article, I’m going to discuss the Head and Shoulders pattern. The Head and Shoulders pattern has the shape of a head and two shoulders, as the name suggests. A head and shoulders pattern can act as a reversal or as a continuation pattern. Whether it acts as a reversal or continuation pattern depends on the trend prior its formation and the type of the Head and Shoulders pattern.
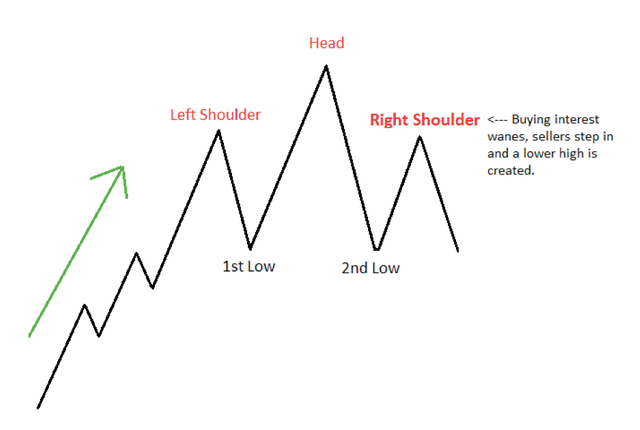
The regular Head and shoulders pattern is regarded as a bearish chart pattern and can be seen below.
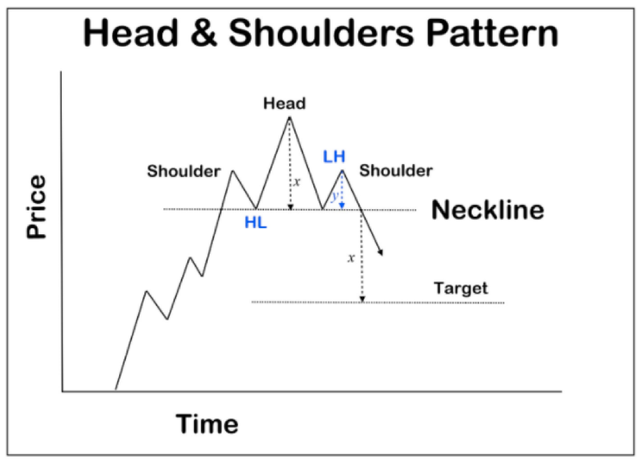
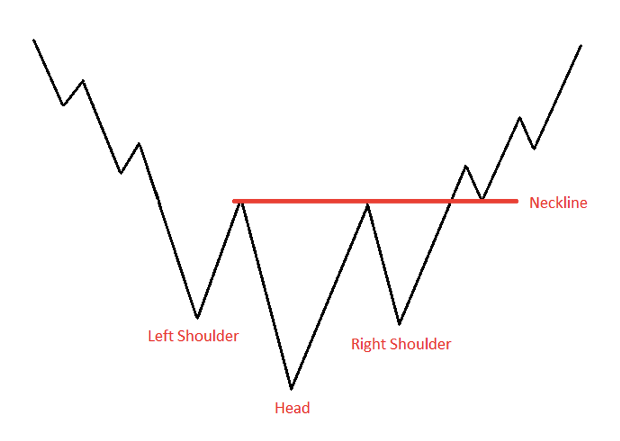
Next to the the regular Head and Shoulders pattern, we have the inverse of this chart pattern: the Inverse Head and Shoulders pattern. The Inverse H&S pattern has the same function as the regular H&S pattern. The big difference between these two patterns is the direction they steer the price into after the formation of the pattern has completed.
Now, we will go through each aspect of the Head and Shoulders pattern.
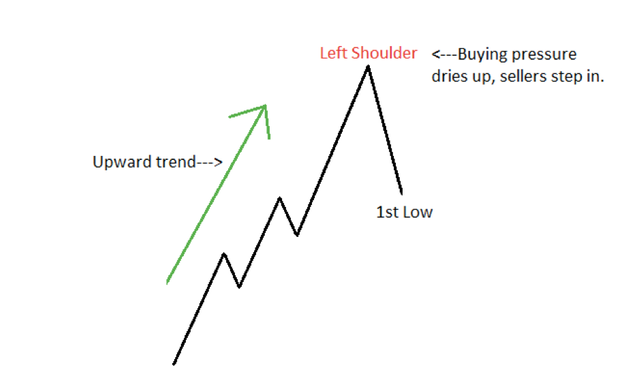
The Left Shoulder
During an uptrend, the first peak (left shoulder) forms after supply exceeds demand, leading to a pull-back/initial retracement in an uptrend. Often, this will be the first significant retracement in the trend, which indicates a battle between the bulls (buyers) and the bears (sellers).
The Head
After the left shoulder has formed, due to the retracement (first low of the H&S pattern), new buyers enter the market. Bears who shorted during the retracement of the left shoulder buy back in as well, leading to the formation of the head. The new buying power combined with the shorters buying back in leads to a peak, higher than the left shoulder. However, buying power decreases as buyers (bulls) get exhausted, and bears gain the upper hand again. This leads to the second low of the H&S pattern. The second low can be higher, lower or equal to the first low in the H&S pattern.
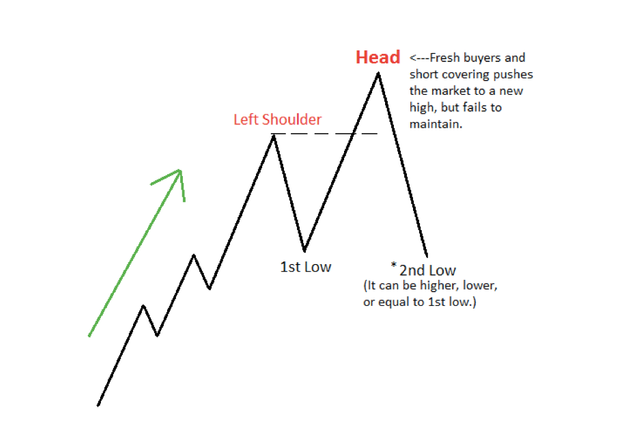
Some traders believe the second low should be lower than the first low of the H&S pattern. This would indicate the decreasing ability of the asset to maintain higher highs and higher lows. On the other side, some believe that the second low should be higher than the first low. This would give a false sense of security for those going long on the asset. The idea for this is that once the H&S pattern completes with a higher second low, the supply of sellers would be larger (those going long), leading to the pullback after completion of the H&S pattern.
The Right Shoulder
After the head has formed, at the second low of the pattern, buyers attempt to increase the price up to a new high (the Right Shoulder). However, this time they fail as sellers increase. The inability of the buyers of increasing the price up to a new high (higher than the head) is for both the buyers (bulls) and the bears (sellers) both a psychological turning point. The buyers will lose confidence in reaching a higher high, and the sellers gain confidence in their stance.
The Neckline
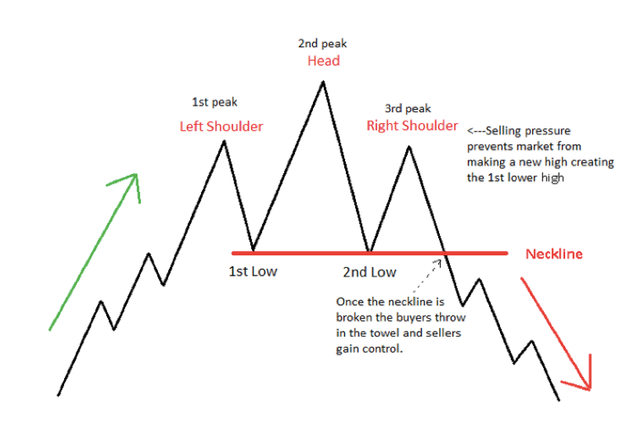
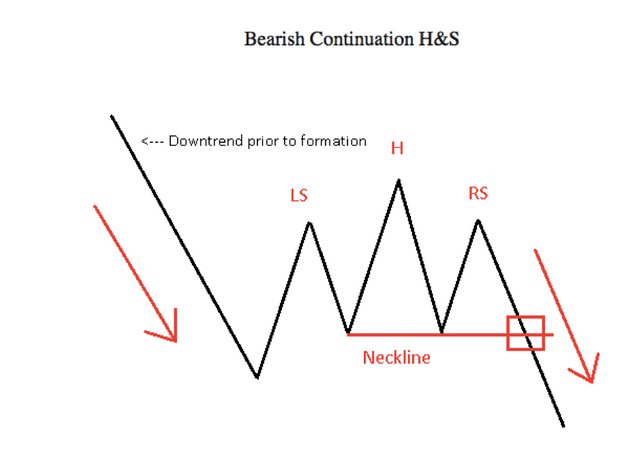
When the right shoulder has formed, we have a complete H&S pattern. We have a third low (after the right shoulder), bringing us to the neckline of the H&S pattern. The neckline is the last defence for buyers (bulls) to prevent a breakdown. Once the neckline (key support) breaks, a trend in the opposite direction emerges. As a result, those going long will go short, which will strengthen the reversal of the trend.
The Inverted H&S pattern.
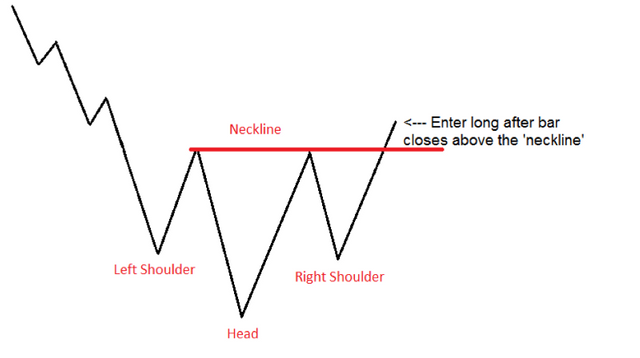
The bullish variant of the Head and Shoulders pattern is the Inverse Head and Shoulders pattern. An Inverse Head and Shoulders pattern is likely to form after a declining trend and is simply an upside-down version of the regular H&S pattern.
Is the H&S pattern a continuation pattern or a reversal pattern ?
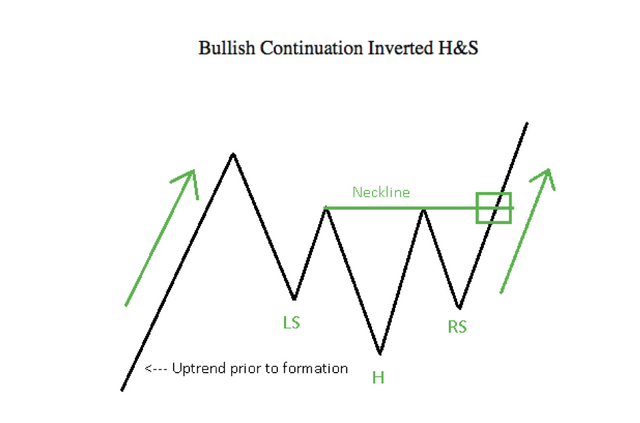
As said before, a Head & Shoulders pattern can act as a reversal pattern or as a continuation pattern, depending on the trend in which it forms and on the type of the H&S. If, during a downtrend, an Inverted Head and Shoulders pattern forms, the pattern will likely act as a reversal pattern, leading to an uptrend after the formation of the pattern. If, during a downtrend, a regular Head and Shoulders pattern forms, it might lead to continuation of the current downtrend.
How to trade these patterns?
One of the most important things to take into account when executing a trade based on the Head and Shoulders pattern is to wait until the formation has completed and to only undertake action when there is a confirmation of validity on the Head and Shoulders pattern. We can confirm the validity of the pattern by waiting for a candle close below/above the neckline, depending on the Head and Shoulders pattern. Typically, the target after a breakout/breakdown will be the length from the neckline to the top of the head (‘x’ in the first image).
In the example below, there is an Inverted Head and Shoulders pattern which has formed during a downtrend. The inverted Head and Shoulders pattern indicates that likely, a reversal of the current trend will occur after the formation of the H&S pattern has completed. To limit the risk of a fake-out, we only go long after a candle closes above the neckline. This would validate this (bullish) inverted Head & Shoulders pattern.
Conclusion
Recognizing a Head and Shoulders pattern and basing a trade on this pattern can be profitable. But one should be cautious regarding the validity of the pattern, by being patient and waiting for a confirmation. In some cases, even when the pattern seems valid, fake-outs still can occur. Therefore, never forget to set your stop-loss orders.
Added to my follow list. Keep up the good work and what do you think of the current market?
Downvoting a post can decrease pending rewards and make it less visible. Common reasons:
Submit
Hi! I am a robot. I just upvoted you! I found similar content that readers might be interested in:
https://medium.com/@CryptoTutor/a-short-explanation-the-head-and-shoulders-chart-pattern-21f6817fba59
Downvoting a post can decrease pending rewards and make it less visible. Common reasons:
Submit
Very useful predictions by top crypto analyst
His prediction success rate 98%
Have look dear
Top 70 cryptocurrencies with their profit targets
May be you have any of them
https://steemit.com/bitcoin/@salahuddin2004/top-70-cryptocurrencies-buying-points-target-points
Downvoting a post can decrease pending rewards and make it less visible. Common reasons:
Submit
Downvoting a post can decrease pending rewards and make it less visible. Common reasons:
Submit