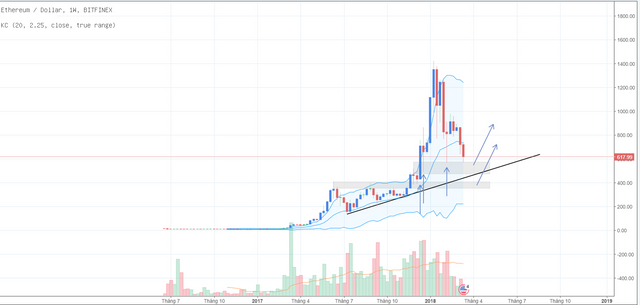
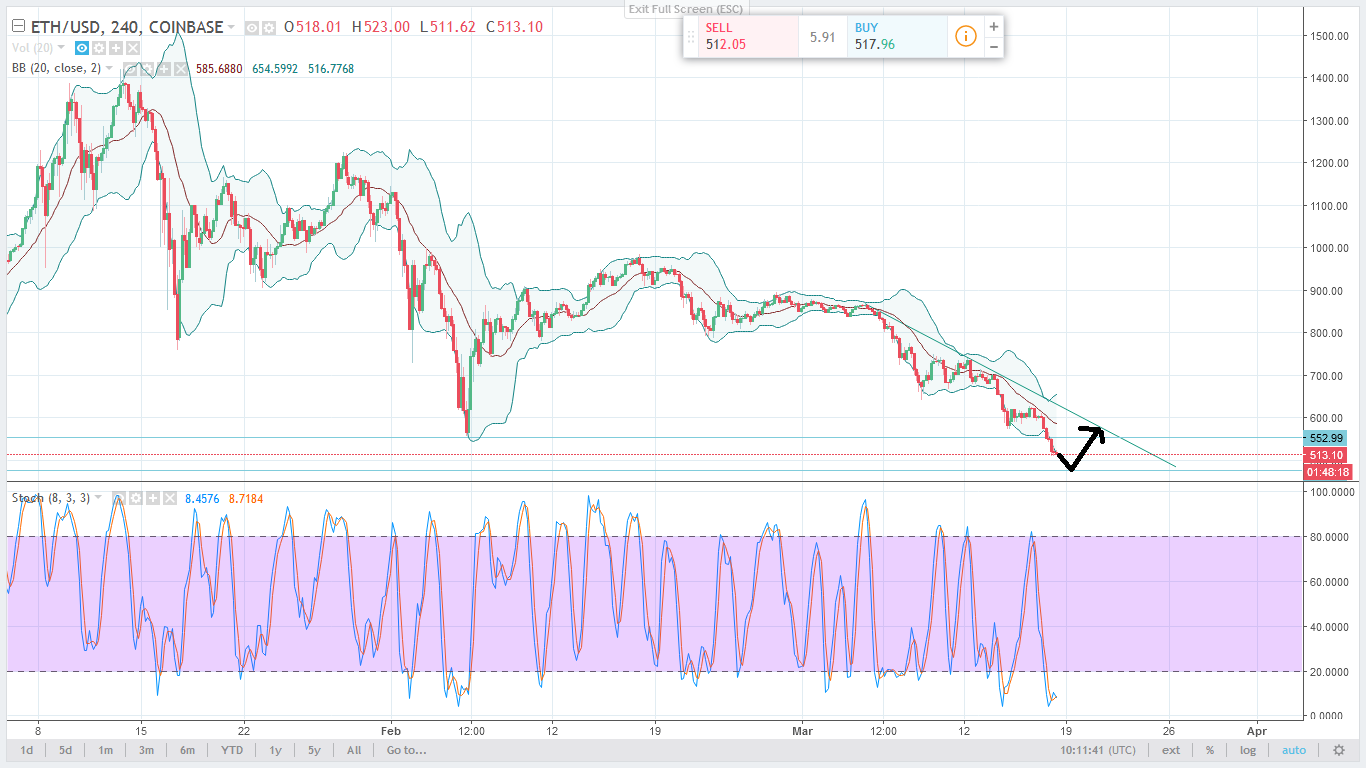
In the H4 chart, the downtrend continues; ETHUSD has gone into the long-term demand zone.
Read my ETH long-term analysis here:
https://steemit.com/ethereum/@cryptocurrencyta/long-term-analysis-ethereum-i-see-the-light

This zone is range from 475 to 575. So I think ETH will reverse somewhere in this zone. But I do not see any sign of reserve at this moment. Stoch(8,3,3) made a lower low, bollinger band expand, MA20 pointed down. So I think the main targets of the downtrend may be 475, as it has support of weekly trendline.

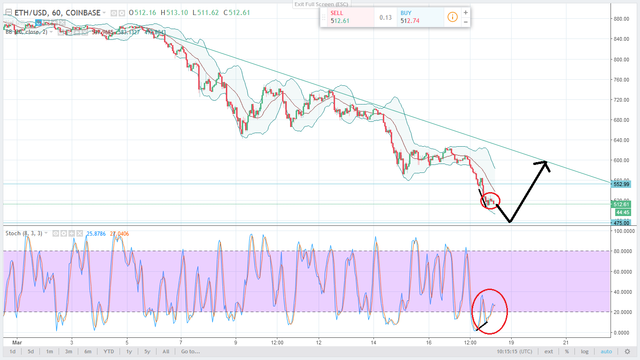
As we can see in the H1 chart, ETHUSD made a divergent trade, and it’s a false signal. So I think in short-term, ETH will go down until it hits any significant resistance.

Legal Disclaimer: The information provided in this blog post and any other posts that I make and any accompanying material is for informational purposes only. It should not be considered financial or investment advice of any kind.
High Risk Investment Notice: Trading cryptocurrency carries a high level of risk and may not be suitable for all investors as you could sustain losses in excess. TAKE YOUR OWN RISKS.