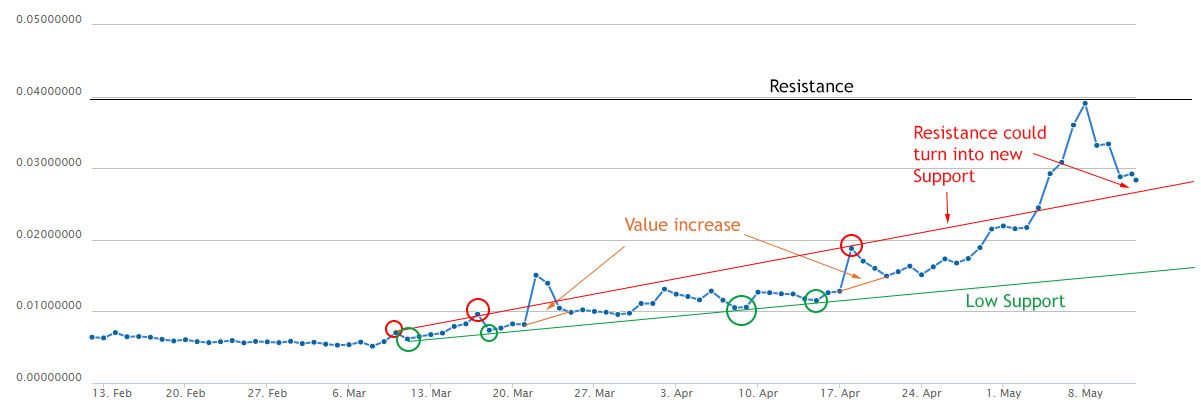
Feathercoin has a long history with a big breakout around the end of 2013, followed by a long period just over the zero mark. It had a few pumps around 2016 but went back down again. Now we are seeing the chart beeing active again but not as high as the 2016 pumps. Why would i care? Because the next halving is approximately 55 days away and the 90 days chart has a nice uptrend, so maybe worth a look ;) Currently i think it will hit the resistance/support line (red) but it could fall just slightly below it which would be a good buy area.
This is just my personal opinion. Investing in Cryptocurrencies is highly speculative and risky. I am not a professional, always do your own research and just invest money you can afford to lose.
Feathercoin/USD - 90 day chart - 2017-05-12
