Direct from the desk of Dane Williams,
This is not your average forex broker blog.
EUR/JPY Technical Analysis
Morning team,
With EUR/JPY in such a strong bearish trend, we've been trading breaks of support for as long as I can remember. Nothing has changed.
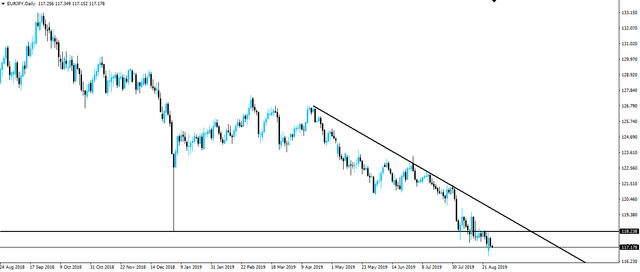
Take a look at where price is sitting on the higher time frame chart below.
EUR/JPY is clearly still in a massively bearish trend, while price has now even dropped below the flash crash low from back in January.
Yep, those big ugly spikes that are all over our Yen charts may finally become obsolete! If you have OCD at any level, and lets face it, you're a trader so chances are that you do, then you're going to be happy that your levels will be clean again.
Anyway, all that really matters from the daily is that we're below in a higher time frame bearish trend and below higher time frame support/resistance.
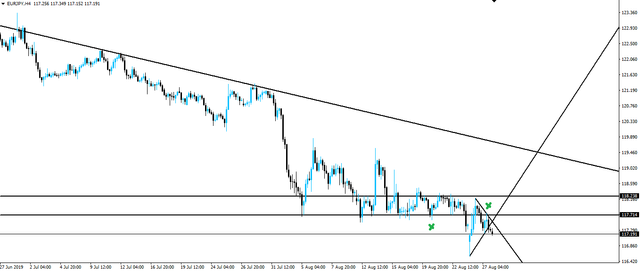
Now step in once more to the EUR/JPY 4 hourly chart and it starts to get really interesting.
I've used the bottoms of those candles that have spiked below the daily line to draw another horizontal support/resistance line on the 4 hourly. You can see that I've marked the most recent bounces that held with the first x.
Price then retested broken support as resistance at the second x, and has now formed some sort of triangle that looks like it's broken to the downside.
You can obviously see where I'm going with this, but I speak about the intraday levels to look at shorting into inside my Inner Circle.
Want to join? Then click the link below and get involved:
Best of probabilities to you,
Dane.
Today's Economic Releases
Wednesday:
USD Crude Oil Inventories

@forexbrokr | Steemit Blog
Market Analyst and Forex Broker.
Join my Inner Circle ⭕️ - www.forexbrokr.com

