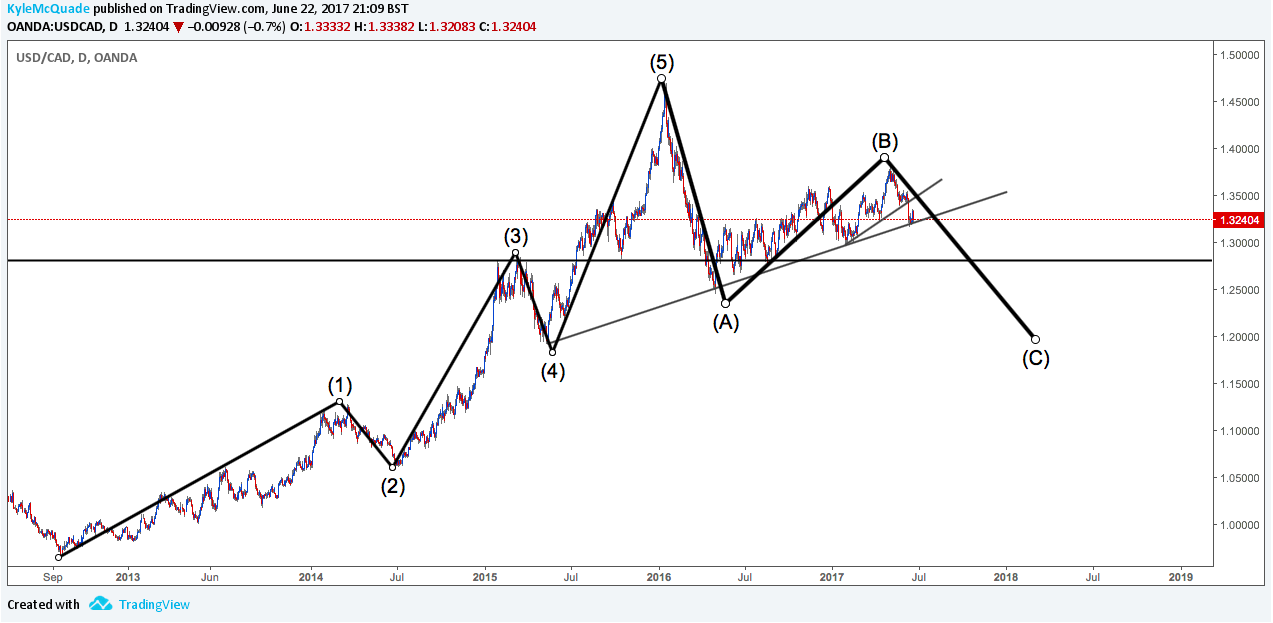
Elliot wave theory is a massive indicator of market cycles. Here the USDCAD has reached the top of the 2nd of 3 correction waves within the structure. This shows the potential for a huge 1000 point drop.

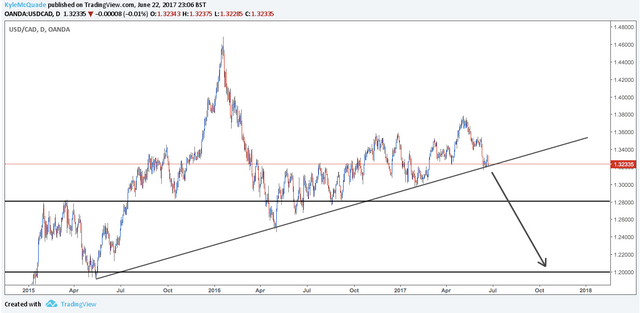
Price is now respecting a trend line since the beginning of the 2nd leg. Once the second leg breaks the trend line, I will be looking at a short position until around 1.2 with a trailing stop loss!

This method in trading is extremely powerful; have a look at my previous Elliot Wave from during the US election last year, you do not want to miss this: https://www.tradingview.com/chart/NZDUSD/4Wp9Avgn-NZDUSD-Bearish-Butterfly/
Good luck!
Kyle.
This post received a 1.7% upvote from @randowhale thanks to @kylemcquade! For more information, click here!
Downvoting a post can decrease pending rewards and make it less visible. Common reasons:
Submit
Brilliant analysis as always!
Downvoting a post can decrease pending rewards and make it less visible. Common reasons:
Submit
@lewisglasgow learned from the best ;)
Downvoting a post can decrease pending rewards and make it less visible. Common reasons:
Submit