Description
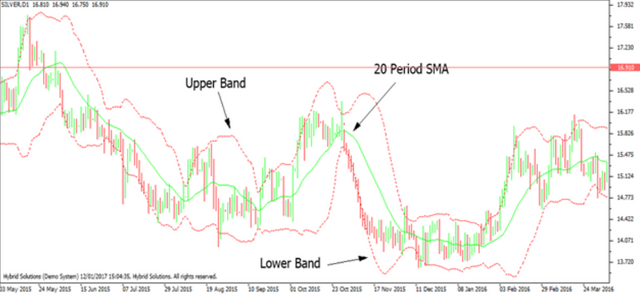
Bollinger Bands are types of price envelope that was developed by John Bollinger. (Price envelopes define
upper and lower price range levels.) Bollinger Bands are envelopes plotted at a standard deviation level
above and below a simple moving average of the price. Because the distance of the bands is based on
standard deviation, they adjust to volatility swings in the underlying price.
Bollinger Bands use 2 parameters, Period and Standard Deviations, StdDev. The default values are 20 for
period, and 2 for standard deviations
Bollinger bands helps determining if prices are high or low on a relative basis. They are used in pairs, both
upper and lower bands in addition to a moving average. Further, the pair of bands is not intended to be
used alone. Use the pair to confirm signals given with other indicator

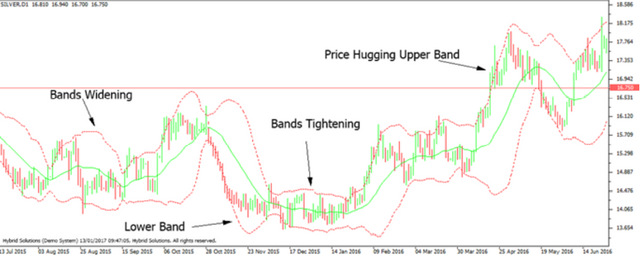
• When the bands narrow during a period of low volatility, it boosts the probability of an intense price movement in either direction. This may start new trend move. We should be careful for false move in opposite direction which reverses before the proper trend begins
• When the bands separate by an unusual large amount, volatility increases and any existing trend may be ending.
• Prices have a tendency to bounce between the bands’ envelope. You can use these swings to help identify potential profit targets. For example, if a price bounces off the lower band and then crosses above the moving average, the upper band then becomes the profit target.
• Price can exceed or hug the band envelope for long periods through strong trends. Traders may want to do additional researches to determine if taking additional profits is applicable.
• A strong trend continuation can be expected when the price moves out of bands. However, if prices move instantly back inside the bands, then the suggested strength is revoked.

Calculation
At first, calculate a simple moving average. Next, calculate the standard deviation over the same number of periods as the simple moving average. For the upper band, add the standard deviation to the moving average. For the lower band, subtract the standard deviation from the moving average. Typical values used:
20 day moving average, bands at 2 standard deviations. (2 times the standard deviation. +/- the SMA).
Middle Band = 20 Day Simple Moving Average
Upper Band = 20 Day Simple Moving Average + (20 day Simple Moving Average + Standard Deviation x2) Lower Band = 20 Day Simple Moving Average - (20 day Simple Moving Average + Standard Deviationx2)
VertexFX is used for the calculation of the Bollinger Bands and for applying it on the chart by many technical analysis and trad.