LESSON: Chart Set Up and the Best Time To Trade
Chart Setup
The type of chart is super important for the Price Action daily set ups that occur. For these we need a New York close charting package that shows a 5 day chart and does not show the extra Sunday candle.
The reason this is so important is because New York close is unofficially recognised as the Forex close time. The other reason is, all the information we need is in the New York close candles and the majority of Traders will be using these.
I personally use the broker IC Markets for my trading and am constantly trying and testing new brokers (I have tested over 50+ brokers) for my charting equipment. More information on the brokers I use for charting and trading can be found in the members only articles HERE. They carry all the Major Forex pairs, a lot of the exotic pairs and also Gold and Silver and other markets like Oil, stock indices etc.
As for the set up of the actual charts the only thing I am super strict on is NO INDICATORS at all when setting up our charts. They are just not needed and when you reach the end of this course you will realise why they are not needed. All that is needed is pure Price Action and the knowledge of how to trade using the information already on the charts.
The use of an MT4 / MT5 demo New York close charting platform is the best and easiest way to go. You need to get familiar with this package for your charting needs. The setting up of profiles in the Weekly, Daily and 4 Hourly time frames for the pairs you choose to trade is the way to make your daily work flow quick and easy to manage. There will be plenty of help in the forum from experienced Traders if you need help to get set up.
The one indicator that can be used when the Trader has perfected their craft of just reading Price Action is Fibonacci. This is less an indicator and more just a tool to see where price is in relation to the current trend. This will be explained later in the course. This however does not go on the set up of the chart and is only ever rarely used!
It doesn’t matter what colour your candles or charts are as long as they are a clean chart they only have Price Action on them.
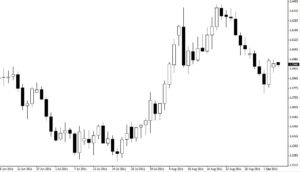
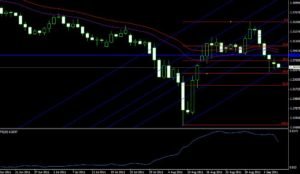
Here on the left is an example of a chart that many Traders have. It has very common indicators on it such as Average True Range, Pitchforks, Fibonacci and Moving Averages. The chart on the right is an example of the type of chart that needs to be used to be a successful Price Action Trader. Note the difference and just how easy it is to see what price is doing. This is all that is needed.
professional_price_action-013professional_price_action-014
Trading Longer Term Time Frames
One of the most important factors when trading price action is the timeframe we trade off. When we start out at this method many want to go down to the smaller time frames such as the 5-10 min. They do this believing the smaller the timeframe, the more chances they have to put on a winning trade!
This is very dangerous thinking. Trading the longer timeframes such as the daily and weekly setups has many benefits not only to the beginner. The longer timeframe charts are more reliable than the intraday charts because they have had more time gone into making them. For example, if a 1hr chart has 1 hour of information the daily chart will have 24 hours of information in it, hence a lot more information to base our decision on.
Daily and weekly charts allow us to have a much more stress free approach to trading. When trading the small timeframes we must think very quickly and must make the right decisions in small amounts of time which is very stressful.
Trading the daily timeframe all we must do is check our computer at the market close. If we see a setup we like, we enter and place our stops and targets and we come back at the next market close in 24 hours to check our trade and manage it. If we don’t see a trade we like we simply turn off our charts and come back the next time.
Two of the most important reasons for trading the daily and weekly timeframe when we begin is because it teaches the novice Trader:
Patience
Discipline
Once a Trader has perfected their craft on the longer timeframes and have been consistently profitable then they may choose to move down to the intraday timeframes such as a 4hr chart. Once they have once again become profitable on the 4hr charts they may choose to try and perfect the 1hr timeframe.
Moving down the charts before being consistently profitable on the higher timeframes is not a very smart decision and shows that you are not ready to be a serious and successful trader.
When people come to trading they normally do so for the same reasons.
Money
More free time
Life of their choice
Then they start trading and find themselves watching the market all day long and not being able to remove themselves from it.
Don’t forget why you came to trading. Stick to the daily and weekly timeframes. They are all that is needed!
Best Time to Enter Intraday Trades
When trading intraday setups we trade using the 4hr, 8hr and the 1hr chart. When trading intraday we must realise some periods are better than others, the Forex market is more prone to moving at certain times.
This is all to do with what session the forex market is in, or what part of the world is awake and trading.
As Forex Traders, we need volatility to make profit. In other words we need the market to move up and down so if the market is doing nothing that is not great for us!


Certain times are more volatile than others and when putting on intraday trades, it makes sense to target these times, to enter the market, over the quieter times when the market is not moving much.
The Asian Forex session which is made up mainly of Japan, Australia, Singapore, China tends to not move very much compared to when the giants of the Forex world are open such as the US and the UK.
You will find the market normally moves the most when you have 2 regions trading at the same time. For example New York and London trading sessions overlap for 4 hours.
When working out how to play intraday trades, always take this fact into account. Check what time your local time is compared to the big players and try to trade when market volume is high.
COMPLETE MODULE #1 TEST
NOTE: Module Test Results will be back down here after you submit your answers.
Price action trading is the skill of being able to read the live price and then use tools like moving averages and MACD to work out exactly where price is heading.
False
True
When starting out with Price action (PA) I should be;
Keeping my charts as clean as possible to focus on live price action
Keeping my charts clean, but it is okay to add EA's and indi's when I need them.
I can chop and mix to have best of everything.
Module One
Duration: 20 mins
Module Progress:
100% Complete
Next Lesson »
« Previous Lesson
Action Steps & Downloads / Links
Complete Module Test