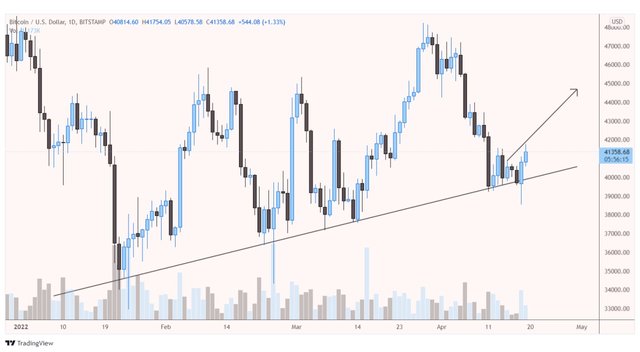
Warning, Bitcoin is gearing up for an Explosive move😍, there's enough evidence in the charts coupled with some fantastic fundamental analysis to why the crypto market as well as the stock market is in for a massive crash. Sit tight, hold your beer 🍺 let's go for ride.
Before we get into the know. There's a disclaimer I need to make, please note that I'm not a financial advisor and have no plans to become one. If you're looking for one, please head to the Bureau of statistics in your country, you'll see handsome men and pretty ladies in suits that can help you out 😂. All what I post here are for educational purposes and for fun alone, no strings attached 😎. Now let's dive into the facts in the charts.
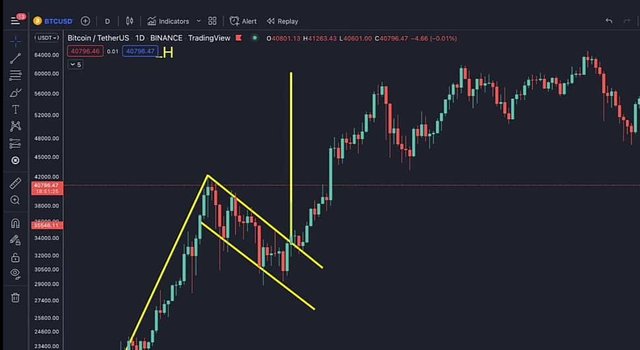
Since this is a crypto friendly space, a good percentage of people here know what a bull flag is, and from the chart above- which is BTC 's performance in January 2021. A bull flag is when there's a massive pump to the upside, then a retracement in a downward channel( many newbies think this is a bad move but hey! That's where the honey at 😋 ). In most cases on a bull flag, to measure the potential price where there's a breakout from the downward channel, all you need to do is measure the length of the pump and place it on either the breakout or on the last support and see where you're at.
What's the potential price for BTC in the short term?
Well, in crypto no one can predict the exact price. You can only read the facts in the charts to get an idea of where we're going to be.
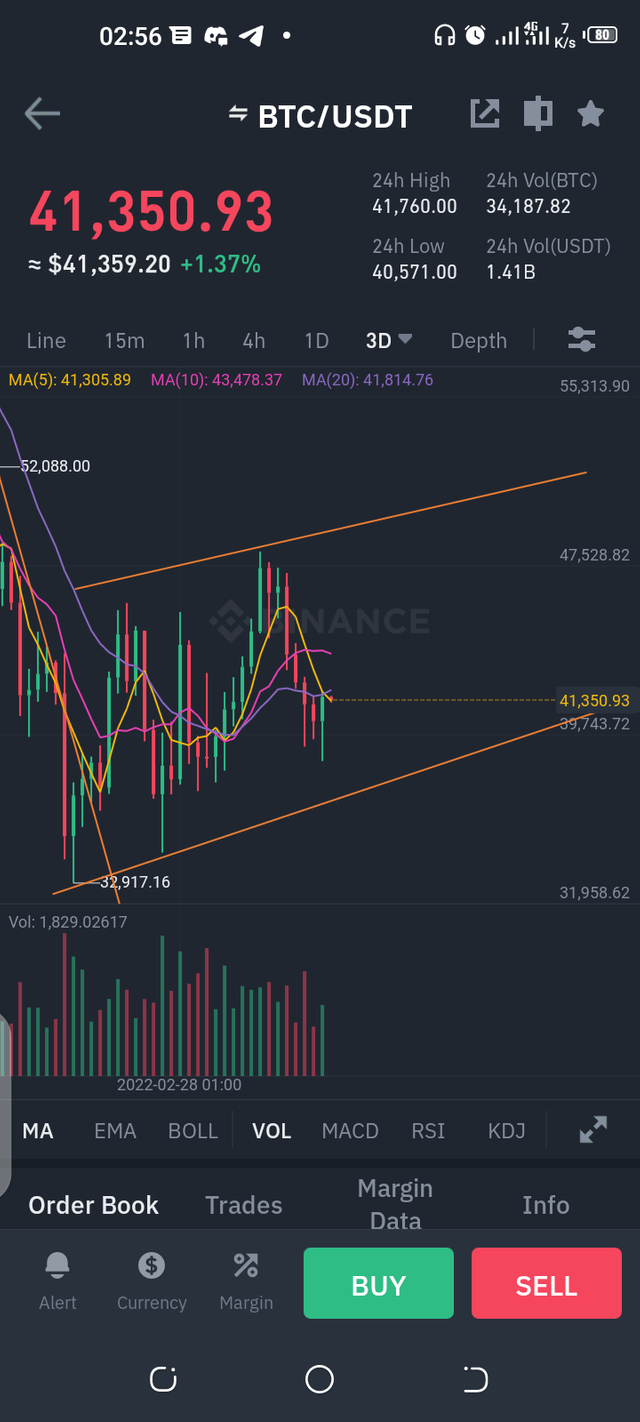
On the 3Day chart, BTC just bounced on support at 40k to form a higher low, signalling the potential of forming a higher high in the bear flag( an upward channel). The potential price in the next few days could be around 49k to 50k
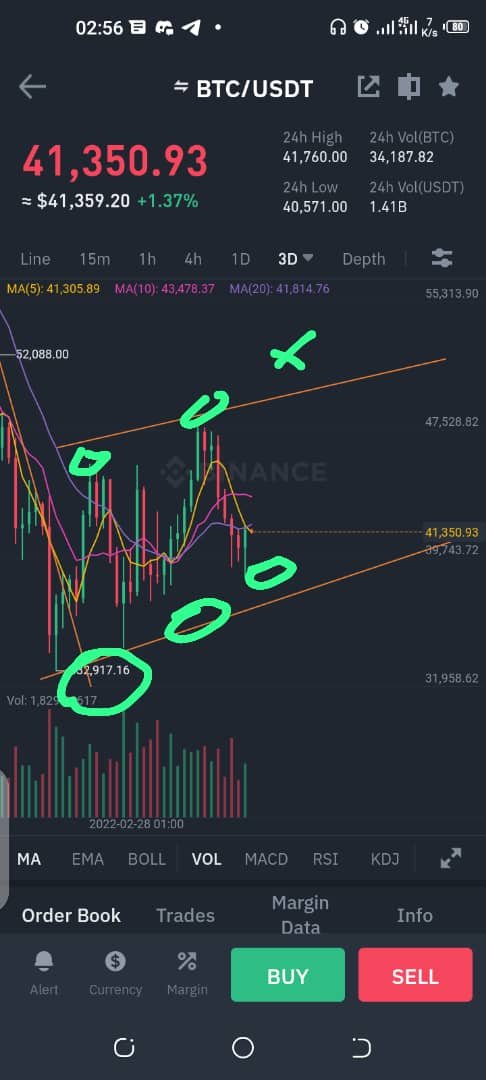
At a price like this, you gonna see many on this space talking about the moon 😂😂😂, but you have to stay focused and level headed to make lots of money in this market.
long term potential price? 🤔
From what was said earlier, since we've been in an upward channel and in a bear 🐨 flag, all we have to do is measure the length of the dump from our All Time High $69k to around 29k, the put it on the breakout or highest point in the channel. When I did that, I have a range of prices. On a lighter note, we might get to $25k. But if the FEDs and other fundamental factors come in play, we gonna touch $20k at least
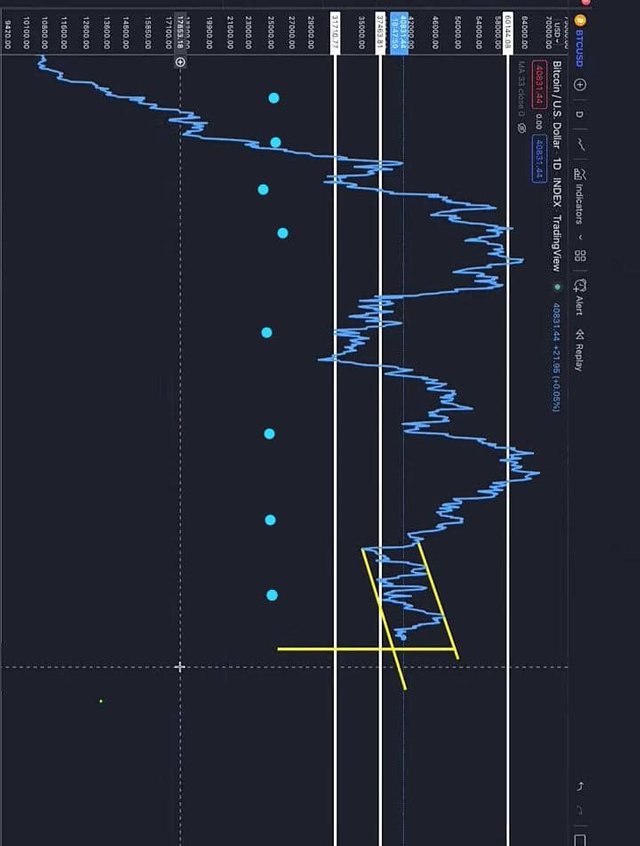
a potential price for the first case to be around 25k
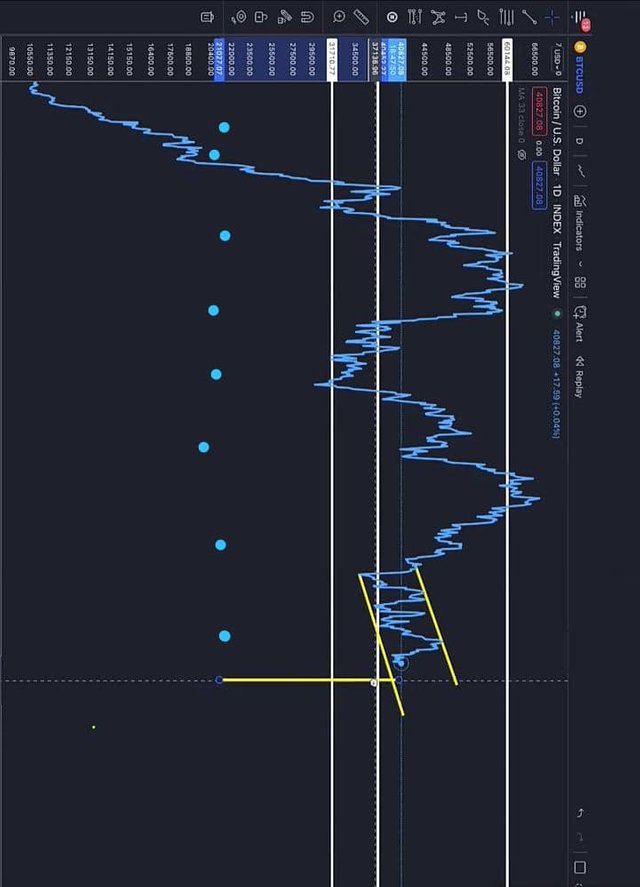
While this could be around $19-20k 😂
Disclaimer again. I'm not a financial advisor, please don't listen to me if you're not sure and have not done your own research. I only post stuff like these for Educational purposes and for fun alone. You can ask questions if you have 😂. Do have a wonderful day/night rest ahead. I'll catch you on the next one ✌😎. @abdex9 ✌