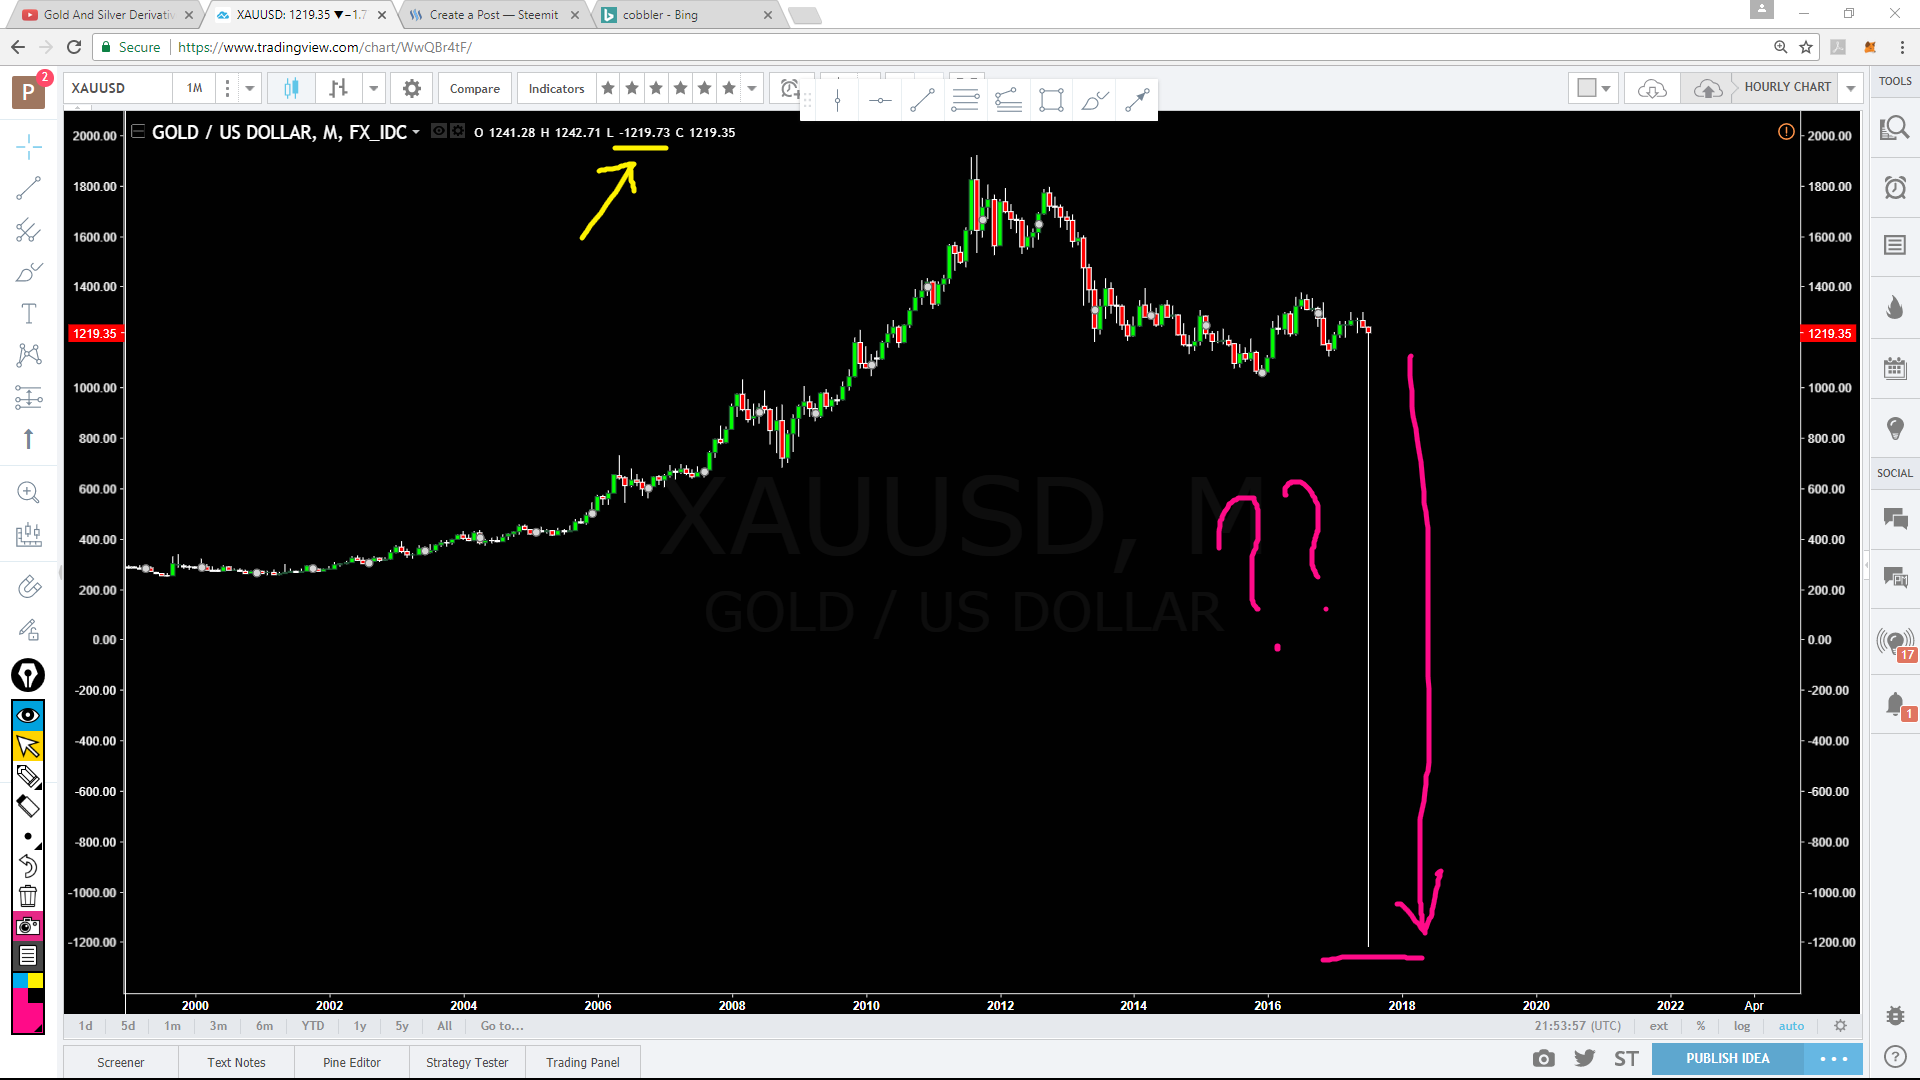
Man, I looked at my XAUUSD on TradingView and I am in disbelieved. Is that wick even for real? I have never seen anything like this.
Gold got so beat-up overnight (I am in Australia), looking at the chart... man, what on God's green earth...
It's not a secret that precious metals are being manipulated and all those criminal activities by the bankers, but what's shown in my chart... I just haven't come around with it
Someone look at the chart below, please enlighten me if you know why the wick dropped to - (yes minus!) $-1217 intraday trading?

Wow. I have no idea.
Downvoting a post can decrease pending rewards and make it less visible. Common reasons:
Submit
I crossed check this on different exchanges that trade Gold ETF, funny it's only at this particular exchange FX-IDC that shows these data. Could it be a computer glitches that just flash crashed Gold ETF on this exchange?
Downvoting a post can decrease pending rewards and make it less visible. Common reasons:
Submit
Congratulations @prodigydefender! You have completed some achievement on Steemit and have been rewarded with new badge(s) :
Click on any badge to view your own Board of Honor on SteemitBoard.
For more information about SteemitBoard, click here
If you no longer want to receive notifications, reply to this comment with the word
STOPDownvoting a post can decrease pending rewards and make it less visible. Common reasons:
Submit
Congratulations @prodigydefender! You received a personal award!
You can view your badges on your Steem Board and compare to others on the Steem Ranking
Do not miss the last post from @steemitboard:
Vote for @Steemitboard as a witness to get one more award and increased upvotes!
Downvoting a post can decrease pending rewards and make it less visible. Common reasons:
Submit