New York Times pinned it correctly: March is getting off to a stormy start with snow and frigid temperatures from the Rockies to Florida.

Meanwhile, for those of you around the East Coast DC area, a climate guy Chris Martz has a channel there called ClimateGuy. He started a new channel which he now called Chris Martz Weather because of an interference with YouTube. If you are looking for regional DC East Coast weather, this is where you want to stop.

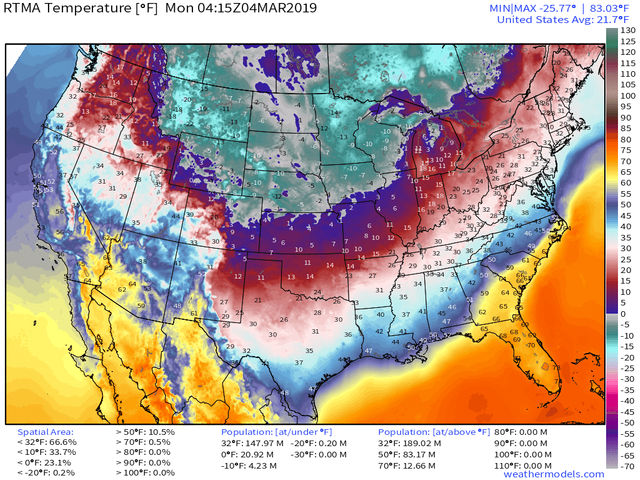
Moving on, that green intrusion or that teal color in Lower U.S 48 and some parts of Canada represents below zero temperatures. Temperatures in those areas are 15 and 20 degrees Fahrenheit below zero.


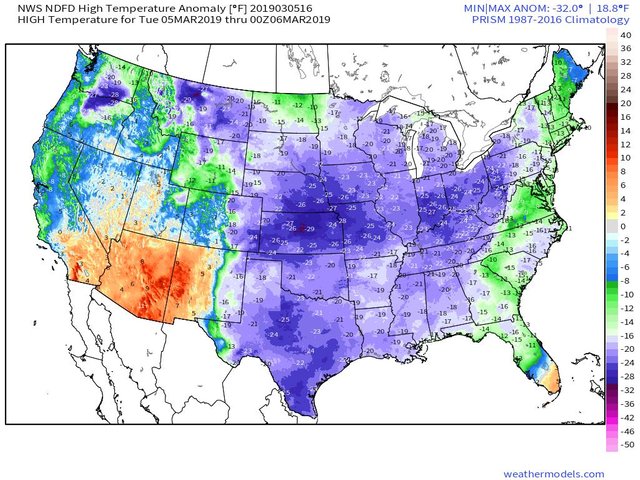
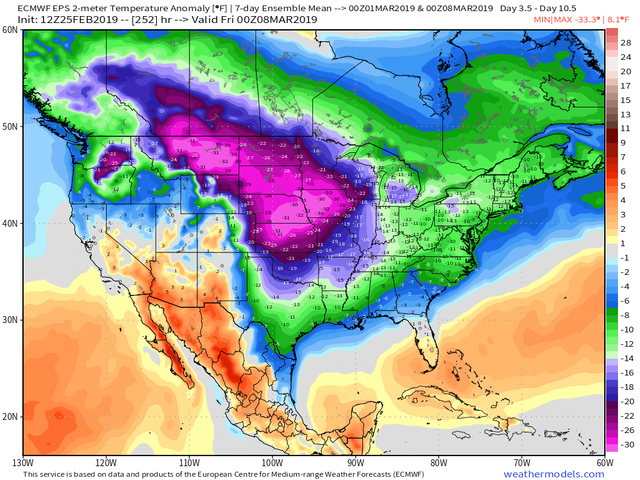
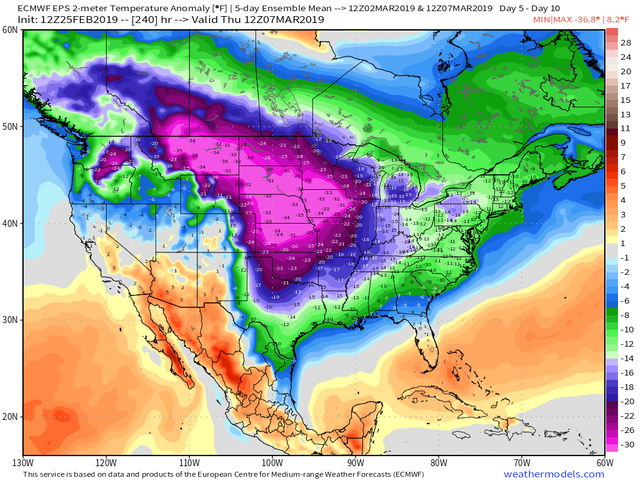
Also, those blue or shades of blue in the map below are of 20 to 30 degrees Fahrenheit below the normal temperatures, problem is daffodils had already bloomed and Bradford pear had also started to flower in Tennessee due to early weeks of being warmer than normal.
This is according to someone whom I talked to in that area, she said that those just froze and wilted over on the vine. You can then expect fruit production anywhere that had an early start to spring would get a pullback in production this year, by extension, fruit prices are also going to rise.

In the meantime, let us check back on the story about the crews and the passengers on the trains that were stuck on the tracks in extremely heavy snows. There were at least 4 accounts of trains stuck on the tracks prompting National Guard and helicopter rescues to finally pull everybody out of there.
I wanted to show this image that was buried in the corporate media. The only place they covered the story was the actual town where it happened. That must be too inconvenient and unimaginable to have that much snow that it stopped locomotives.

On the other hand, Phoenix has finally reached an 80-degree Fahrenheit day. This is the first time for 2019, but in general, these 80-degree days occur by February 9. It has run almost a full month late before the normal temperatures returned here, so you can expect that spring planting season would also be delayed.

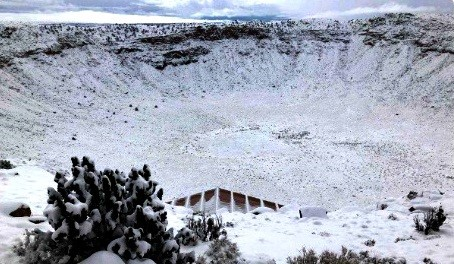
Then looking back as well, February 22nd, 23rd, and 24th at massive record snows across Las Vegas. Check out all those amazing pictures showing these massive snows that came down, specially this crater in Arizona covered in snow.

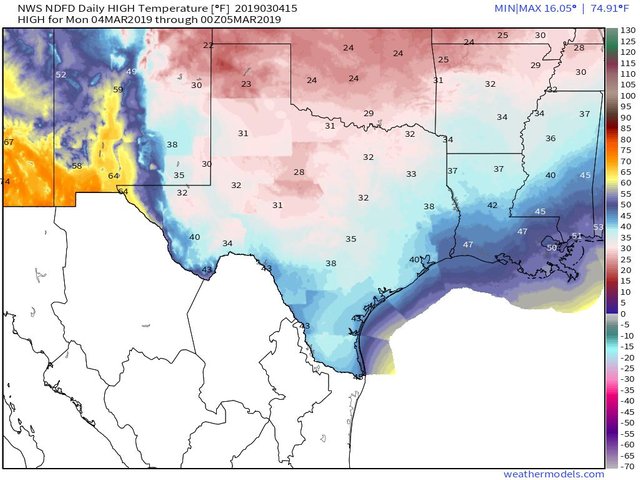
So this seems to be the trend, more moisture, more snowfall, and cooler temperatures are in the desert areas of the United States. Over in Texas, the more reddish brick colors are in the 20 degree-Fahrenheit range. When you get into the lighter blues, those are freezing or just a little bit above. Down in Northern Louisiana is at 37 degrees Fahrenheit which is way low, not normal at all for this time of the year.

Speaking of snowfalls, De Moines, Iowa record snowfall, but this place is a well-known spot for extremely cold winters and extremely heavy snowfalls, but here they are, breaking the record back to 1886.
Who would have guessed that if a Grand Solar Minimum was intensifying, we would go back to the 1800s, 1600s and even 400-year records being broken? The worst is yet to come, wait until 2020 to 2021.

New record low temperature in Elk Park, Montana with 46 degrees Fahrenheit below zero on March 4th. That smashed the record back in 1897.

As always, Ryan Maue, gave this amazing forecasts for the future weeks. This is a month out of the GFS Models Chicago, O’Hare. Bringing you through March 4th, even in the byline, not a lot of March days with below zero temperatures were seen in Chicago for the last 150 years.

So as this super freeze 3.0 progresses through the US, it is very possible that temperatures are going to tip below zero in Chicago in March. I thought winters are supposed to get milder with the Global Warming? No they will not. Winters will get cooler due to the Grand Solar Minimum.

Now take a look at Atlanta, temperature of 11 degrees Fahrenheit, with the wind chills, in March.

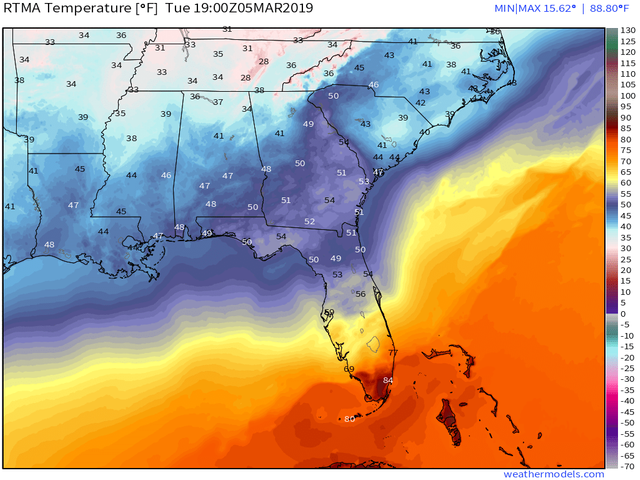
As you can see in this regional map, Tennessee all the way down to Florida, Miami, the Keys, full-out West to Louisiana and Arkansas are all in blue. This means that fruit crops there are being destroyed because they budded early. This is the same thing that happened last year, so you can anticipate that it will happen next year as our jet streams continue to move out of their normal flows. We are going to get these early warmings in February, which the IPCC will absolutely say an indication that CO2 is warming the planet. But then we are going to get these super freezes that will come in and wipe out all the crops that have started to bud early.

Expect for fruit prices and berry prices to be up. I keep reiterating this because it is very important for you to understand that this is a trend. You should be able to map this out so you can prepare yourself to take action and be ready.

Next year is going to be worse, and by the time we come into 2023 and 2024, everything you buy is going to be 2 to 3 times more expensive.

Jumping over to severe-weather.EU comparing Europe’s freezing cold temperatures in Norway with what they had in the United States. This is a side-by-side polar vortex comparison.

They even had a freezing emoji for the Norway weather service, 28 degrees Celsius below zero temperature in Europe. Take note, that is not in Fahrenheit, that is in Celsius, but once you get around -32 and -40 degree mark, Fahrenheit and Celsius temperatures start to match. So we are looking at something around -25 degrees Fahrenheit in Norway which is extremely unusual for this time of year, even in what you would consider Nordic countries. This is incredibly cold.

But again, all the news media says it is just weather. I cannot believe it! When it is hot, it is Global Warming, but when its record cold, it is just weather.

Regardless of what we are labeling this weather, plants are responding differently. They do not care, they were awoken early because of the equatorial vortex bending out of its normal flows and the heat coming up from the equator is in the wrong place at the wrong time. Grasses are now growing, they are sprouting flowers and blooming buds, then back to super freeze, where we get these snows and record cold temperatures. This for example, is what happened in Estonia. These extent of weather anomalies are happening in Europe as well as in the United States.

And we also have these major food producing continents that are going to be crushed in terms of their yields this year. The crops that will drop in productions include many of the things that we eat.

Look at this report on Food Production and Use. As can be seen, food prices are rising in the supermarkets. But please understand, it is not CO2, it is not you, it is the Sun in its 400-year cycle.

Furthermore, take a look at University of Alabama Huntsville (UAH) records for February temperatures. Remember, the media said February was so warm, record hot. It was even tagged the World’s Record hottest February ever, but looking at it closely, it was the same temperature as January 1. That is a one hundredth of a degree difference. If you get that kind of variance, that is considered a rounding error.

Then we have Dr. Roy Spencer’s site, I really like how he presents his data sets. Instead of just showing the temperatures, he breaks it down by region so you can compare regions across the globe. I took out February 2018 and February 2019 temperatures, which I put side-by-side in that yellow box. Those are all the temperatures that decreased.
The Australian media and the Bureau of Meteorology (BOM) keep non-stop yapping about this warmest year ever and about the winter there to be the hottest ever, but if we look over the years, the temperatures actually dropped more than a tenth of a degree. Take a look at the U.S Lower 48, US, that is almost a full 1-degree Celsius drop, not Fahrenheit. So you can expect Lower 48 to go even lower next year. Why is the Arctic dropping in temperature if it is supposed to be warming up there?

These are the questions that are supposed to be asked by the news media and to the IPCC in their next presentation. Why are they not taking into account solar variability, Grand Solar Minima, and Cyclic activity in our Sun when they put out their projections?
Because if somebody can simply do the match-ups of the solar activity and the declines in global temperatures, why can’t the IPCC do the same with all their millions in funding? These are two very good correlations of prior declines in solar activity, not in the Grand Solar Minimum 400-year periodicity, but these are in the 100-year, 200-year sunspot counts.

Here we are, this is where we are going with the new 400-year Grand Solar Minimum cycle we are entering and it is intensifying as we speak. This is why the weather is so strange on our planet. Government leaders do not want to spook you because they know that if they tell you what is going on, people are going to freak out. Panic would be everywhere and this is what they are trying to avoid. This information is not meant for the mainstream.

I do this channel because we are to go through this together. Please visit my advertisers My Patriots Supply long term food storage, water filtration, dehydration equipment and everything you need to get your own food supply stored for a long period of time.

Thanks for reading, I hope you got something out of the article. If you like more information like this I produce the tri-weekly Mini Ice Age Conversations podcast, 30 minutes of in depth analysis on the GSM you can take on the go.
Mini Ice Age Conversations Podcast
iTunes: https://itunes.apple.com/us/podcast/adapt2030
Soundcloud https://soundcloud.com/adapt-2030
Libsyn http://adapt2030.libsyn.com/
For the bi-weekly Grand Solar Minimum climate update newsletter from myself, David DuByne, (ADAPT 2030) jump over to oilseedcrops.org you can enter your email and sign up. Move your mouse around for about 10 seconds and this box will pop up.
Join ADAPT 2030 NEWSLETTER http://www.oilseedcrops.org

“Help support the adapt 2030 channel on brighteon so we can keep Grand Solar Minimum information free to access.”
https://www.brighteon.com/channel/adapt2030
Support ADAPT 2030 by Visiting Our Sponsors
ADAPT 2030 & My Patriot Supply 2-Week Food Supply with 92 servings
www.preparewithadapt2030.com
True Leaf Market Heirloom Seeds ADAPT 2030 True Leaf Market Link
ADAPT 2030 Amazon Grand Solar Minimum Book Store https://www.amazon.com/shop/adapt2030
Upheaval: Why Catastrophic Earthquakes Will Soon Strike the United States https://amzn.to/2E7KbBt
*** Today’s Story Links ***
Global average lower tropospheric temperature (LT) anomaly for February, 2019 was +0.36 deg. C, essentially unchanged from the January, 2019 value of +0.37 deg. C: http://www.drroyspencer.com/2019/03/uah-global-temperature-update-for-february-2019-0-36-deg-c/
South East USA Temperatures
Temperature anomalies USA
Chris Martz Weather
https://www.youtube.com/channel/UCJpLVLkTddcGATPN3lfz3Gw https://t.co/X5O0I809cv
Chicago temperatures in March 1 degree F above zero 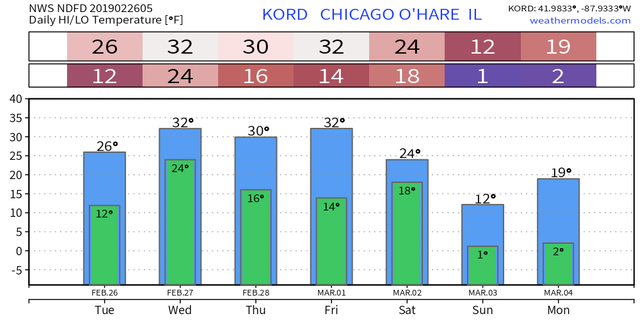
Temperature models March 2019 USA Canada
*** ADAPT 2030 Social Media Links ***
PATREON https://www.patreon.com/adapt2030
YOUTUBE ADAPT 2030 Mini Ice Age 2015–2035 Series on YouTube
BITCHUTE https://www.bitchute.com/hashtag/adapt2030/
BRIGHTEON https://www.brighteon.com/channel/adapt2030
STEEM https://steemit.com/@adapt2030
MINDS https://minds.com/ADAPT2030
MEDIUM https://medium.com/@globalcooling
FB https://www.facebook.com/Miniiceage
TWITTER https://twitter.com/adapt2030