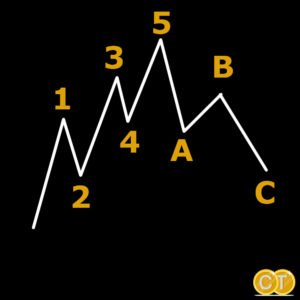
 Elliott Wave Theory
The technical analysis of the current development tells us very much.
To much I don't want to bore you with technical terms or irritate.
Only a brief explanation: General based my analysis on the Elliott Wave Theory.
This theory States that there are 5 waves.
(A high 1 – down 2 – up 3 – down 4 and a high 5)
Then a cycle is completed and it goes down a whole piece again.
Very simply explained, admittedly, but sufficient for the Moment.
The waves I'm going to draw in the BTC Graph:
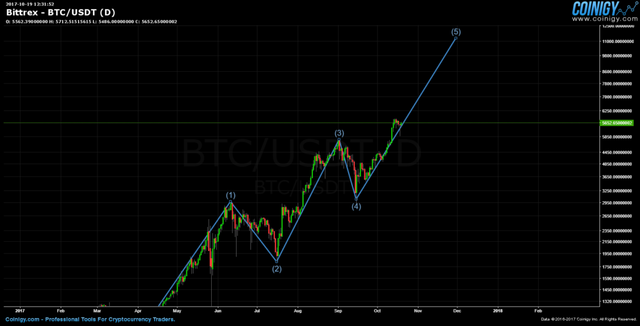 BTC Elliott Wave Theory
- Start point: We have set the line at the increase in March as the start of such a cycle
- (1): The first rising phase, until the middle of June 2017
- (2): The correction of the course to the middle of July 2017
- (3): A second and a massive increase to an all-time high of 5K at the beginning of September 2017
- (4): right short correction of the course to mid-September 2017
- (5)The potential curve according to the Elliott Wave Theory to December 2017, down
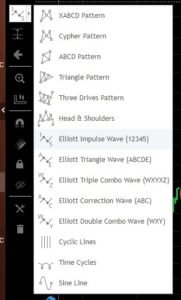 Elliott Wave enable on coinigy
If you take the analysis even in the case of Coinigy or Bitfinex & co. to draw want a small note:
Use the "log Chart"that you over longer periods of time a more accurate picture. To do this, you activate the "Toggle Log Scale" in coinigy on the bottom right next to the automatic scaling.
The Elliott Wave Theory you can use the tools on the left of to select and step-by-step drawing.
In the analysis you will need to have a view of 1 day (for me), or 3 dayselect.
A simple theory is and well. But you know me and maybe something.
It must always be several indicators combined . In my analysis, I use the Fibonacci Retracement.
I set the Start after the first rise (1) and use the low point of the correction (2) for the lower line of the Fibonacci Retracements.
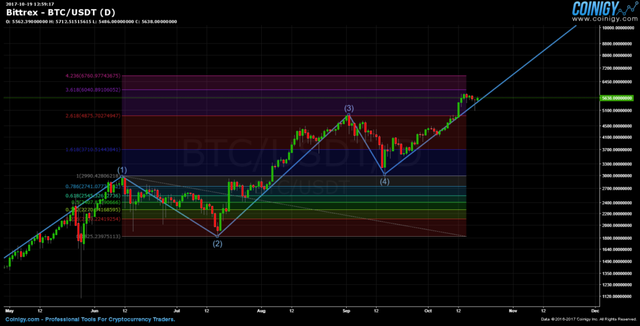
The theory States that we can accept in a good "bull phase" is the 2,618 line as the next possible high point.
And as you can see – BAM.
We met almost exactly at around 5,000 USD.
Now, we apply the indicator to the second correction.
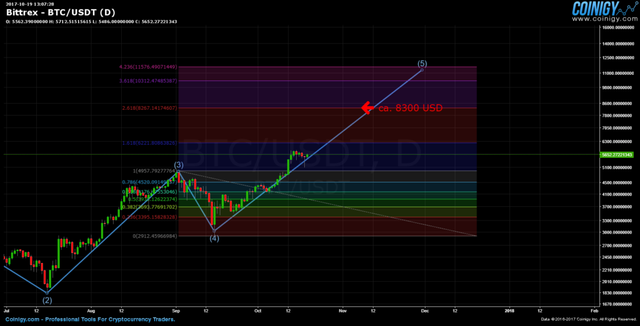
When we get back to the 2,618-line to adopt, then we have a very conservative estimate.
The course is in the forecast. 8.300 USD to rise. In the scenario you've made a good Plus, if you have purchased at the current rate, (approx. an area of 5,600 USD).
I guess the 3,618-line but very realistic . Then the rate would rise to about 10.400 USD.
A smart capital management would be in this development that you are already at the 2,618-line a part of your Bitcoins to take out. So, you have by the removal of perhaps even your investment (depending on when you went in). The Rest comes "on top", but you're on the safe side.
If I of my beautiful 11.300 USD for December at BTC talk, then corresponds to the approximately 4,236-line. This is my designated target, what I expected even 2 months ago. Only, the number not released now so blatant. 😉
Further safeguarding of These
Now I am going to call some crazy, that I consider those Figures to be realistic.
Then let's look at a few indicators and more.
Trend lines in Trading one of the most important indicators. I have allowed myself a couple of times einzumalen.
Not to scare you, there are a total of four trend lines:
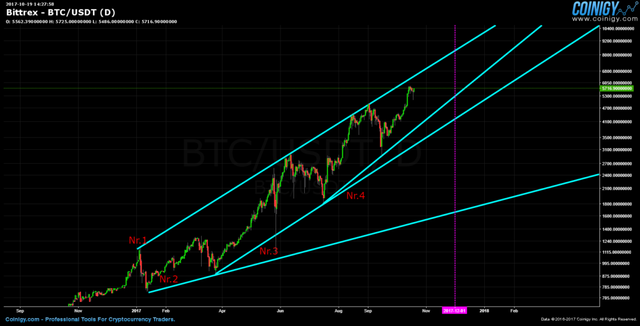
- Trendline no. 1: My most important trend line since the beginning of the year. This has been pointed out time and again reliably at the high points.
- Trendline no. 2: A slightly older trend line, the newer was replaced.
- Trendline no. 3: A lower trend line with the low points of the correction. What is interesting about this is that the line of the recent correction was not achieved. It is not quite parallel to No. 1.
- Trend line no. 4: The new trend line with the low point, the no. 3 is no longer reached.
That's what we call a "parabolic development". The course develops a non-linear, special on a imaginary parabola.
With the trend line no. 1 would be the beginning of December, 2017, the rate on approximately 8.300 USD. (The point of intersection of the violet vertical line)
But if we assume that the parabolic development, it is possible that the price breaks through this trend line out.
And still steeper, than was previously the case.
A couple of important data are still the Bitcoin Gold Fork on 25.10.2017 and another Fork planned in November.
To these data of the Bitcoin show a little more movement.
Around the turn of the year, and Christmas is, in General, reached the peak.
If you know the beach test and about it, then you can, if it goes down again, cheap new BTC shopping.
Bitcoin in 2018 & 2019
Now if you believed that the 11,300 to USD are crazy, then the following forecast wait times.
With the current Trend and the history I have led lines in 2019 and 2020.
<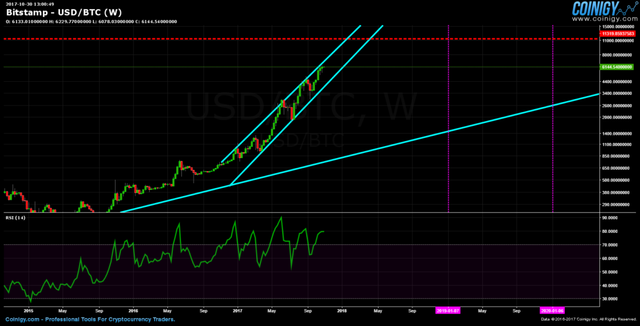 BTC trend line in 2019 & 2020
In the graph, the data is no longer on it, but the points of intersection lie in the following Ranges.
- 2019: 100k USD in a range of Plus or Minus 20k
- 2020: 1.000 k USD after the million mark, the price certainly re-corrected to 200k
I give to you.
Just as BTC was in 2013 to a level of USD 10 could also imagine no one the development of 6,000 USD.
But it remains exciting, what is the mass market and the countries up to the end of 2020, with the Bitcoin of the line.
The purely technical forecast looks good. You will only be braked, if, for example, would decide the United States that BTC will be banned or other similar actions.
The can so far see no one in his crystal ball.
With a few BTC on the "High edge" are you advise but in the long term.
Conclusion for the BTC development:
I refer again to the analysis of the BTC-development from July.
The mentioned correction had taken place. Also, the mentioned development.
That is not to say that I me on the shoulder knock, but that the market situations repeat themselves , and the signs of my forecast.
Even if we "only" up to the Level of 8,300 USD, it would be a very good development.
So take my value is not as accurate and you can look forward, if the Call is pointing in the right direction for you.
grabs his crystal ball again
Much success in Trading and HODL
it was pretty good analysis of bitcoin
Downvoting a post can decrease pending rewards and make it less visible. Common reasons:
Submit
Thanks my friend
Downvoting a post can decrease pending rewards and make it less visible. Common reasons:
Submit
Hey @t4ka96, great post! I enjoyed your content. Keep up the good work! It's always nice to see good content here on Steemit! Cheers :)
Downvoting a post can decrease pending rewards and make it less visible. Common reasons:
Submit
Thanks I will write again :)
Downvoting a post can decrease pending rewards and make it less visible. Common reasons:
Submit
Keep this up, Followed you for more :)
Downvoting a post can decrease pending rewards and make it less visible. Common reasons:
Submit