Hello everyone,
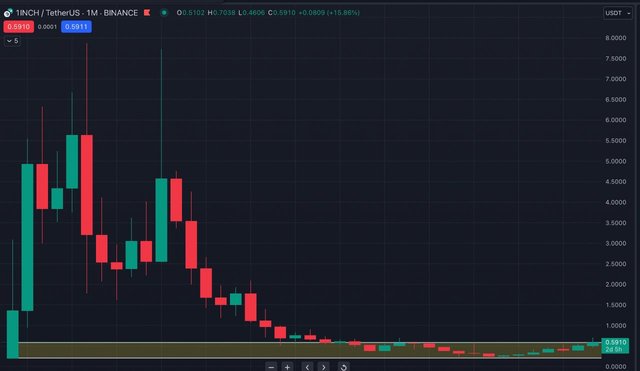
Today, I'd like to discuss a project called 1inch, which is essentially a decentralized finance (DeFi) project forked from Uniswap. It's currently hovering around its listing price. Approximately seven months ago, it touched an all-time low.
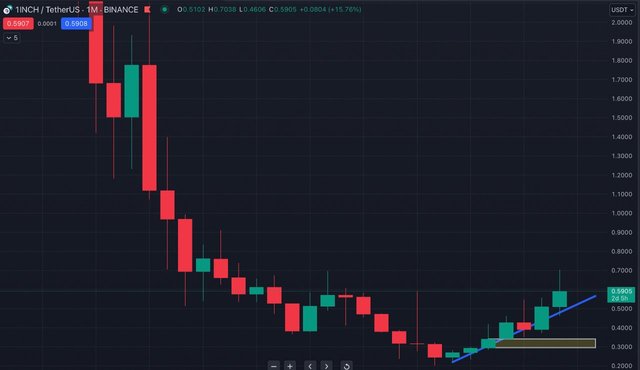
However, at this moment, the monthly chart indicates a potential uptrend. There's a significant liquidity zone only between $0.30 and $0.33, which is being closely monitored on the weekly chart. If there's no negative news affecting the market, it's likely to remain at this level for now.
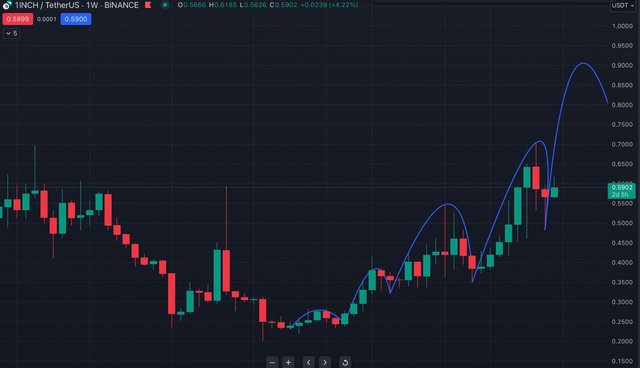
On the weekly chart, it's creating a label-to-label supply and demand zone. So far, it seems that it's absorbing all the liquidity from the sell side and moving upwards.
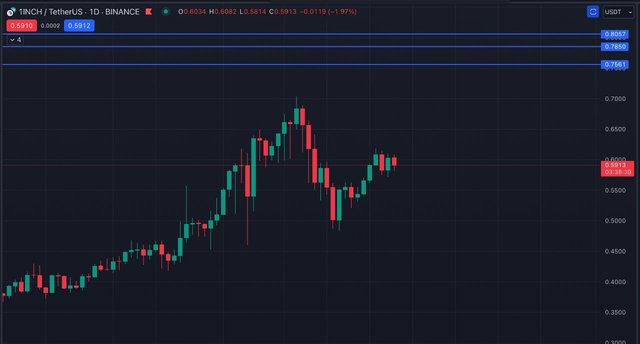
On the daily chart, I can see an accumulation of liquidity around $0.58, which is often referred to as a "retailers' zone" or a support level. However, there's a possibility of tapping into liquidity around $0.56.
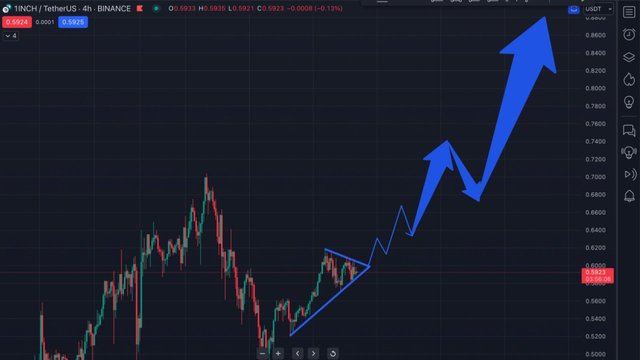
Looking at the four-hour chart, it appears to be forming a base between $0.59 and $0.63. Here, it's evident that there's a liquidity security net at $0.74. If it grabs this sell-side liquidity, it could retrace towards $0.91.