Designed With Canva.
It is always a joy for me whenever I have the opportunity to participate in the Steemit contest weekly and today I will be participating in the crypto academy community contest. Stay tune below.
Question 1: Explain the Concept of Divergence in Trading
A lot of people might have different meaning to the world divergences as it is popularly used in the financial world wether in the stock trading, Forex trading or crypto trading. But generally when we talk about Divergence in trading, it is actually a word that is used in the technical Analysis in trading that helps to point out changes in market trends. Most of the times it happen in a situation whereby the price of a particular token trend oppositely to the direction of a technical indicator as explained in the class.
There are technical indicators that we have which can point out the trends. Examples like Relative Strength Index(RSI), we have the Moving Average Convergence Divergence(MACD) and we have the stochastic oscillator also. Most of the time, when we have divergences, it also point out that the trend that might be current might actually reverse or probably the trend might still continue also depending on how it comes and the token in analysis.
Types Of Divergences
Divergence is majorly classified into two major types which is the Bullish Divergence and the Bearish Divergence. Even though they work in the divergence pattern but they also work differently and have their own significance and what they point out when trading or probably when doing market analysis.
Bullish Divergence
When it comes to the Bullish Divergence, it talks about the price of that particular asset in analysis making a low that is quite lower but when reading it on the technical indicator, it is showing it is making a higher lows. Most of the time, when we have a bullish divergence, it is showing that the selling pressure is getting more weakening and the momentum is changing.
- How Bullish Divergence Works
The way the Bullish Divergence works is that when there are lots of lower lows, it means that particular asset is in a massive downtrend and at that particular time, the selling pressure is increasing and the technical indicator take for example RSI might show higher lows as against the lower lows, then it means the selling pressure is getting more weakened and that means we might be having a trend reversal in an uptrend direction soon.
- Example Of Bullish Divergence
Let's take for example, the price of Steem is rapidly falling and then it actually makes a new lower low much more than the other low it might have make, even though you might view it using the RSI indicator and the indicator is showing a higher low, then the disagreement between what the RSI indicator is showing and what the real chart is showing means the price can continue to drop and a downward momentum is around the corner rapidly.
- Significance of Bullish Divergence.
Talking about the Significance of Bullish Divergence, there is the Early Warning Of a Reversal. Most of the time and like I said bullish Divergence will point to you that the downtrend is not as strong as before and we might be having an uptrend taking place soon. Most of the time, buyers use the bullish divergence to actually have a buying opportunity.
Bearish Divergence
Talking about the Bearish Divergence, it directly the opposite of the Bullish Divergence. What I mean is that it means the asset will be making a higher low but at that particular time, the technical indicator is making a lower high at that particular time. Even though the price of the asset might be rising, it shows that the buying momentum is getting more weakening. In opposite to what the bullish divergence indicates, when we have bearish divergence, it most times indicate that a trend reversal to the downtrend direction is about to happen.
- How Bearish Divergence Works
Bearish Divergence works in a way whereby the price of the asset have a higher highs and that the buying pressure is high, the technical indicator which might also be RSI for example might be showing higher highs then it means the upward momentum is actually fading. When divergence like that happen, it means the bearish reversal is actually around the corner.
- Example Of Bearlish Divergence
Talking about the example of bearish divergence, let me also use the example of Steem as example. Let's take for example, it is making a new higher high, but let me use MACD making a more lower high, then it actually means it is indicating that the uptrend is getting more weakened or rather the buying pressure is getting weakened and so the downward trend might take place soon.
- Significance of Bearish Divergence
The significance of Bearish Divergence works in a way that it helps to give a warning of potential downtrend. Most of the time, Bearish Divergence might point out that we might be having the uptrend to change soon to a downtrend and traders also make use of Bearish Divergence to take out their profits which is getting to notice more selling opportunities.
Question 2: Identifying Divergence with the RSI or MACD
I will be making use of the Steem/USDT chart to identify Divergence Chart both for the bearish and for the bearish Divergence and I will be making use of the RSI for it.
Example Of Bearlish Divergence Using RSI indicator on a Steem/USDT Chart.
Alright these are the settings for my RSI indicator
- Rsi Period - 14
- Overbought - 70
- Oversold - 30
Other Settings
- Timeframe - 1 Hour
- Historical Time of the Chart - 28th/July/2024
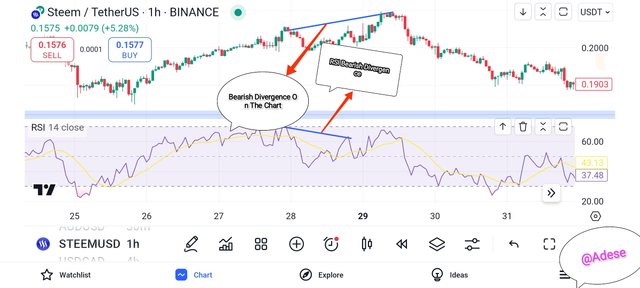
As you can see in the screenshot below, the point was picked when the price of the Steem was $0.2022 and then continue to when the price was $0.2092
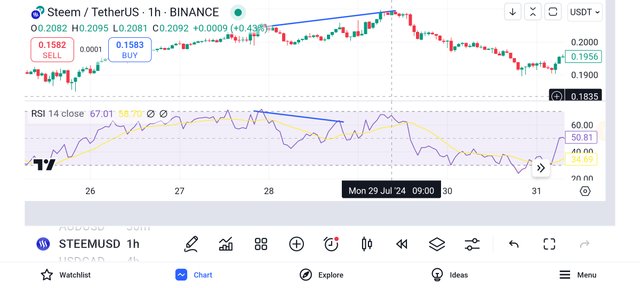
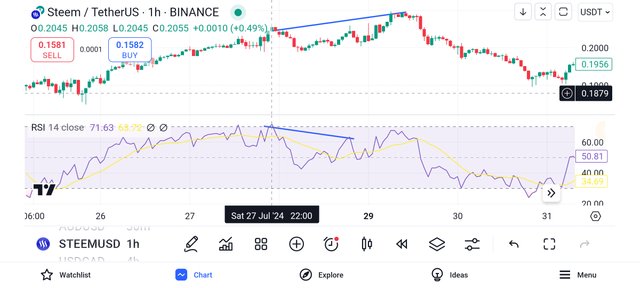
Looking at it properly and now the bearish divergence might have influenced the trading decision is in two ways;
- Risk Management - Take for example, I am.a trader who is holding the position example long position, this bearish Divergence on the chart will give me a warning sign that I should take my profit as early as possible so that I will not be affected by the downtrend reversal that is about to happen.
- Entry For Short Position - Apart from been an avenue for me to take my profit from the long position already on ground, this can also be an entry signal for short position but of course I will still need to wait for more confirmation like the next candlestick pattern that form which should be bearish.
Question 3: Combining Divergence with Other Indicators
In combining Divergence using Different indicators. I will be making use of two indicators which is RSI and Bollinger Bands.
Alright these are the settings for my RSI indicator
- Rsi Period - 14
- Overbought - 70
- Oversold - 30
Bollinger Bands Settings
- Basic MA Type - SMA
- Standard Deviation - 2
- Length - 20
Other Settings
- Timeframe - 1 Hour
- Historical Time of the Chart - 28th/July/2024
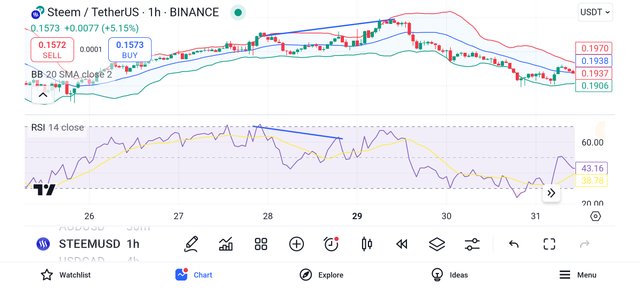
Alright these were the settings I used on the chart above in order to combine both Bollinger Bands, Relative Strength Index Indicator for the divergence strategy. One of the things I noticed after using these two indicator is that it helps to actually strengthen my trading decision because it makes sure I get less false signals.
Talking about the aspect of RSI, whenever I noticed that the RSI is forming Lower highs, and the price on the other side is having a higher highs, it is giving me a sign of a weakened bullish momentum and vice versa. On the other hand, one of the significance that Bollinger Bands helps me to actually achieved is that when I notice that the price is moving to the upper band, it is giving me a sign that the asset is about be overbought and vice versa.
Using the chart above, one of the ways I was able to combine both of them is to make sure that whenever I noticed a lower high on the RSI take for example the bearish Divergence example I follow, I make sure that the price of the Steem is breaking beyond the upper Bollinger Band as you can see in the picture below. So the combination of the divergence I notice on the RSI indicator and the upper Bollinger Band makes sure I am more sured that there will be a downtrend reversal soon.
Developing a Divergence-Based Trading Strategy
Talking about developing a divergence based trading strategy, well ten major tool I will just uses is just to make sure I notice both the entry and the exit points. Why I will be making use of that and also of course including the Bollinger Bands, support and resistance and also the candlesticks patterns to help achieve the overall strategy.
The Strategy Overview
Primary Signal - One of the primary tool I will use for the primary signal is the relative strength index as it will give me the divergence view. Then it will gives me both the Bullish and the Bearish Divergence view making use of the RSI
Confirmation Entry - When trying to confirm the signals, I will definitely make use of the Bollinger Bands so that I can know either the Overbought state of the asset or the oversold state of the asset. I will also try to locate both the support and the resistance level to help notice areas where the price of the asset might want to go up or go down.
Step-by-Step Trading Strategy
Identification of Divergence - The first thing I will make use I notice is the identification of the Divergence. I will make use of the RSI indicator of course using the Standard Period of 14 and try to look out for the bullish or the bearish Divergence pattern following the conditions I have discussed above
Confirmation Of The Divergence Using Bollinger Bands - The next thing I will try to do is to make use I follow the Bollinger Bands to get the Confirmation of the Divergence Entry depending on how the price of the asset either for the upper band and the lower band.
- Finally Checking The Support and Resistance Level- Then the last Process which I will try to follow is to make sure I checked for the support and Resistance so that I can pick my entry from there.
Example Trade Using Steem Token

Let me.use the Steem/USDT as an example, you will see from above that the RSI have already formed a lower high which has point out that is the bearish divergence. What I will do next is to make sure that I get my confirmation signal and that is when the price of Steem have touched the upper Bollinger Band as it will show me that it is then overbought.
Then the next thing I will do is to take my trade which will be a short trade because the bearish candlesticks have formed. I make sure I place my stop loss to the last resistance level to help in my risk management level.
Limitations and Best Practices of Divergence Trading
Divergence over the years have proven to be a common and to a very great extent trusted strategy that traders used in trading whether it is crypto trading or Forex trading to help them point out trend. Even though it comes with its own limitations. As a trader one of the things that will give you edge over these limitations is to understand those limitations and make sure you position yourself so that you can avoid those pitfalls and improve your trading decisions and the result that follows.
- Divergence Does Not Always Lead to a Reversal - The first limitation you should understand is that not every time do the divergence leads to reversal. I was also guilty of this limitations years ago when I was using this divergence trading strategy for my Forex trading journey. I always feel every divergence will lead to reversal but most of the time it is not and that is why you need to make use that you get confirmation signal before entering your trade. I have discussed above how to get your confirmation signal.
- Did Not Depend On A Single Indicator - The second mistake that traders make most of the time is that they always depend on only one indicator. What do I mean by that? It is not wise that you make use of Divergence with only RSI or MACD. Sometimes one indicator might not give you the total view about how the market is behaving and so It can give you false signal at the end of the day. You need to make use of multiple indicators to get more reliable signals.
- Getting Flase Signals In Low Volatility Markets - I actually forget to establish this that most of the time, Divergence Trading Strategy work in a market whereby there is High volatility. Most of the time when there is low Volatility, you might be getting false signals and one of the solutions to that is for you to trade divergence when you notice the market is having low Volatility.
Best Practices for Using Divergence in a Trading Plan
- Combine Divergence with Other Indicators - This will be the first Practice I will ask the Trader to implement. Make sure that you combine the divergence with other indicators. What do I mean by that? Make sure that you are using other technical indicators like RSI, Bollinger Bands, MACD and many more so that you will be able to get a true trade setups. Sometimes it is better you make use of something called the trend indicators so that you can get the market direction.
- Use Multiple Time Frame Analysis - I think this should not new for any experienced trader. The mistake you will be making is only depending on only one timeframe for your entry. Make sure that you combine a lot of timeframe for your confirmation as it will help strengthen your setup.
Use Risk Management Techniques - The last one you should make mention of is that you should always allow risk management to thrive so that you can guide your capital. Make sure that you risk low per trade and make sure you follow a risk to reward ratio. It can be 1:2 ratio and beyond.
Be Patient - One of the downfall of many trader is that they are not always patient. They just rushed to Trading because they want to quickly get results. You need to make sure that market comes to you and not the other way round. Make sure you avoid overtrading.
- Keep a Trading Journal -
The last one I will like to talk about is that you should keep a trading journal. Someone will ask me why? The more you record your trades, you more you are able to pick some lessons from your trade and this will help to improve the decision making process of your trading journey.
Thank you for this lecture, looking forward to more interesting and benefiting lectures in the more weeks to come
I invite @lovelystar , @newekemini5 and @okere-blessing to drop a very constructive comments on this post and also to participate in this contest.
https://x.com/AdeSe1484785/status/1853918168928113151?t=dv51qJ8g_P536gAyfjGm8w&s=19
Downvoting a post can decrease pending rewards and make it less visible. Common reasons:
Submit