Hello, everyone; I hope you all are doing well. I am here to share my participation in Steemit Learning Challenge season 22, week 3. So, let's start this week's lesson. I hope I will give a good explanation of each question. I would like to invite my friends @drhira, m-fdo and @yahnel to share their participation.
Risk management is too much important for protecting capital against potential lost and ensuring long-term profitability in cryptocurrency trading. We know crypto is a too much volatile market, without proper risk management strategy we may experience a heavy loss. Let’s discuss some of it’s key principles and practices:
Position Sizing
The basics principle of managing risk in crypto trading. Position sizing means allocating the money in a single trade. It should be 1% to 5% ( maximum) of your total portfolio.
For example, if you have $5000 in your portfolio and you want to open a trade on steem/usdt, open a trade only worth of $50. Now incase you lose this trade, $50 deduction from $5000 will never effect you.
Stop-Loss Placement
Stop loss mean my trade should close if it reach to a certain point with certain lost. This is also of much more importance in crypto trading. It prevent your account from liquidation, which we mostly see in volatile market or when a huge crash comes or when market get manipulated by whales.
Example, I open a long trade on Steem/USDT with a current price 0.28. I have analysed it technically and i found out that 0.25 is it’s strong support. Now if it break this level i m no more interested in this trade and i accept lost up to here. It’s obvious if they price break this level their is more chances it will dump more ( may up to 0.20), and as long as it’s above 0.25 i will never close my trade.
Diversification
By Diversification we mean, spreading portfolio in different assets. Diversification is also a key factor in crypto trading, because it helps us minimizing lost ratio. Suppose we put all our portfolio in DOT coin and it get dump, because of it’s bad fundamental then we will stuck badly here. In contrast, if we buy some other coins too along with Dot, like steem, sushi, xrp, ada, doge, etc their are chances we might get safe.
Example, if have $10000 in my portfolio, i will divide it into different portions; high market cap, meme coins, low market cap and will invest in them accordingly.
Proper DCA
DCA stand for dollar cost averaging. This is the best way of safe trading in crypto market. Let me tell it’s strategy how does it work?
Let suppose I allocated $500 out of my total portfolio for steem. I have bought steem at 0.30, but i will invest something $250 here. If market goes up obviously i will be in profit i don’t need any DCA, i will get exit at profit. But what if the price comes down, DCA helps us here. We will buy steem again at 0.25 of $100. It dump again it reach 0.18, we will buy it again of $100. Now if steem go back even Upto 0.25 ( our second buy zone) i will be overall be in profit. Suppose i have invested $450, if price come back to 0.25, my $450 will be something $550. This is the real power of proper DCA.
The best way of calculating risk to reward ratio is watching how much risk of lost in the trade, same should be the profit(1:1) our keep the profit double (1:2). The best RRR is 1:1 or 1:2. let’s implement it practically on Steem/USDT chart.
STEEM/USDT chart of 15 minutes frame.
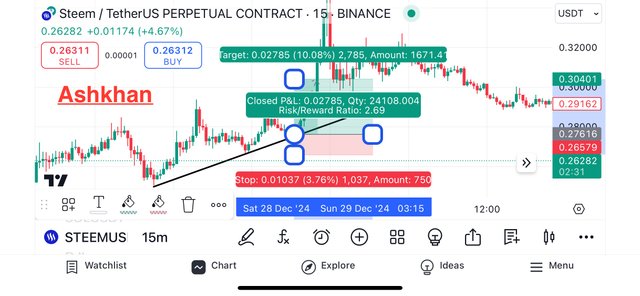
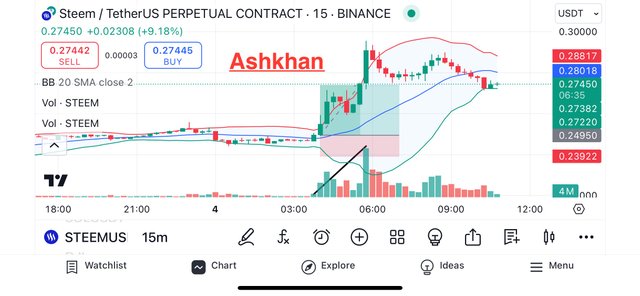
15 minutes we use for scalping. In scalping we use very less amount in a single trade. I will use only 1% of my total portfolio in this trade ( $10 out of $1000 portfolio). This is a long trade, steem price third time touched that trend line which indicates it is a strong trend line. I go for a long position with 1:2.7 risk to reward ratio and you may see my trade got win. It give me a $27 profit.
| Entry point: | 0.276 |
|---|---|
| Take profit: | 0.30 |
| Stop loss: | 0.265 |
STEEM/USDT chart on 1 hour time frame.
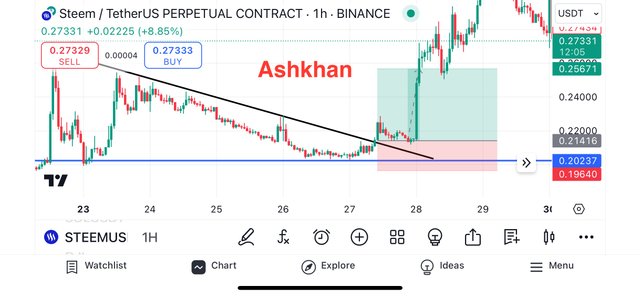
This is an important chart pattern (descending triangle). It give a break up in up direction, creating a best scenario for long position. Our trade is 1:2.4 and it hit our target. Take profit we decide on the basis of previous high and stop loss on previous low and support.
| Entry point: | 0.21 |
|---|---|
| Take profit: | 0.256 |
| Stop loss: | 0.196 |
Using Bollinger Bands to analyze market volatility
Bollinger bands have 3 standard deviation lines; a moving average and a lower and upper band. It tells us the market volatility, if market is volatile, the bands are open and if less volatile or ranging market, the bands are narrow.
Bollinger Bands work on three principles
First strategy: If price touch lower band it indicates oversold region, a buying signal.
Second strategy: If price touch upper band it indicates overbought region, a selling signal.
Third strategy If it cross the middle average line in upward direction with increasing volume, signal long position. The same, if it cross the average line in downward direction with increasing volume it signals downward move(short position).
Predicting current market situation of Steem/USDT using Bollinger bands.
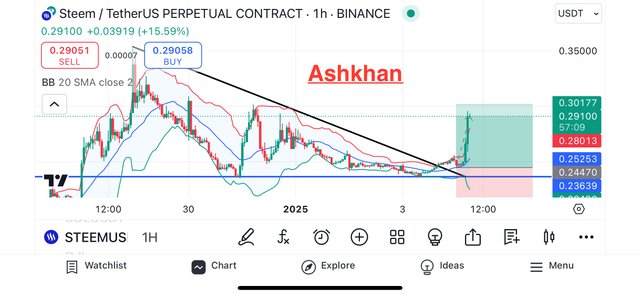
This is one hour time frame Steem/USDT chart. Steem is making important chart pattern of descending triangle. It give break through in upside ( buying signal). Bollinger band is also giving a bullish indication.
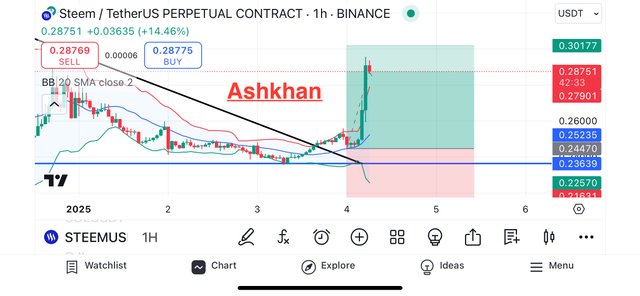
If we look it more closely we can see, the price touched the lower band, our support also lies there. It respect it and move upward, and then for more strong confirmation it break the chart pattern (descending triangle) and took retracement toward the moving average. After touching moving average a sharp movement is seen.
Using Average True Range (ATR) to analyze market volatility
ATR measures the average range of price movement over a specific period of time. It indicates the overall market volatility. Higher ATR means high volatility and lower ATR means low volatility. ATR is commonly used to dynamically set stop-loss levels or adjust position sizing based on the risk profile of the trade.
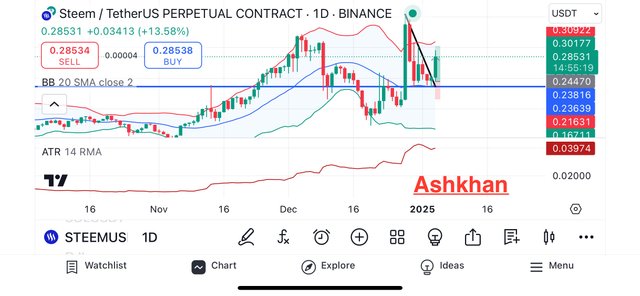
In this current daily Steem/USDT chart we see High in it’s price. ART is too much high with a value of 0.04. It means on an average this is the difference between each two candles (whether increase or decrease).
How to Use ATR to find stop loss ?
We multiply ATR value with with 2 (ATR x 2) and make it our stop loss. Now in this case steem has an ATR of 0.04 so our stop loss will be (0.04 x 2 = 0.08). Suppose we open a long trade at the current price of steem (0.28), our stop loss will at 0.20. The ATR stop loss is considered the safest one, many people use it like (ATR x 3) which is considered the most safest one.
Note One important thing i want to share is that, we should avoid trading if ATR value is too much high. Now in Steem case it’s high, but not that much. We consider is normal.
We have many principles and rules, which we follow decrease the risk of losing our assets. If they are properly followed those, on an average we will always be in profit. Let’s talk about them here.
Strategy Framework
Position Sizing
Position sizing help us reducing risk. The best positioning for each trade is 1% to 5% of the total portfolio. In case of hitting stop loss, we will lose the amount which will not effect us that much.
Risk/Reward Ratio
Most often risk to reward ratio is 1:1 or 1:2. It means the amount you are ready to lose in a trade and the amount you think you will win in this trade should either be same or double. It vary person to person, but 1:1 and 1:2 are the most people risk to reward ratio in trading.
Using perfect Stop loss
It helps preventing traders from liquidating their accounts. We should always use perfect stop loss after breaking of our important levels; support, resistance, important chart patterns, and trend lines.
Proper DCA
For spot trading DCA is the most important and profitable thing. It gives us a chance to make profit even if market goes against us. In DCA we buy more coin at every dump.
Following market conditions
Never ever trade against trend. Always follow the market trend and try to find opportunity for trade in that direction.
Avoid trading in volatile market
Bollinger Bands and Average True Range (ATR) are the best tools to find market volatility. Always try to avoid trading in volatile market, which is too much risky.
Now let’s apply all these strategies practically on STEEM/USDT.
STEEM/USDT chart of 15 minutes
First thing is position sizing, i will put 1% of my portfolio in this trade. Second important thing is risk to reward ratio which is 1:2.5, means my if stop loss is $1, my TP will be $2.5. I have a perfect stop loss at 0.239 at lower Bollinger band. I have seen the market in larger time frame it’s in uptrend, do i m following the trend. Last thing which is to check market volatility, use market is somehow volatile, but i have managed the volatility using these above principles.
I have a recent example related to KEKIUS MAXIMUS. This is a meme coin backed by Elon Musk. He some days before changed his X (twitter) name and profile picture. We have seen almost 2000% pump in this coin because of it. Their was a trader who have swiped 62 billions Pepe for Kekius, worth of 1.2 million dollars.
He took entry without any proper research, followed by FOMO. He took entry when the price was already 1500% pumped. When Elon musk change his profile again, we saw a 70% dump in KEKIUS price just in one hour. That guy stuck badly and his $1.2 million, became $400k just in one night. This was the bad trading psychology (FOMO and Greed) which led him to a huge lost.
What could have been done differently ?
- Their isn’t any risk management on his behalf. He his $1.2 millions and invested all in one project.
- He should have done proper research before taking such a huge risk.
- Kekius dumped again, he should have waited for a perfect entry.
- This was a FOMIC and greed based buying decision, which also is a huge mistake.
