Introduction
In the finance world, a "Market" is instituted by the presence of buyers and sellers, exchanging assets of varying values with the aim of making a profit. This interaction between buyers and sellers is represented graphical on a price chart, with generally accepted symbols that convey meaning to the market participants (buyers and seller).
Market reversal as explained is a change in the market psychology of the participants. Market reversal is associated with a change in sentiment from upward movement to downward movement or vise versa.

Image Source
Market participants use various tools like candlestick analysis, indicators, chart patterns, to determine price reversal points on the price action chart.

Question 1
Open a demo account on any trading broker and select five cryptocurrency pairs
Source
For this demonstration, I created a demo account with FXCM broker Link and linked the demo account to Tradingview platform Link.
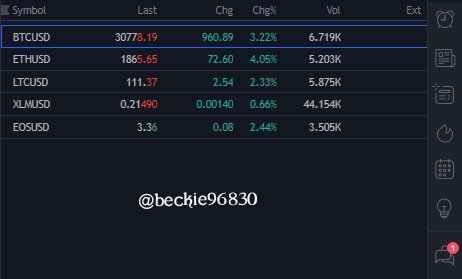
Crypto assets selected
I selected five crypto assets from the available crypto pair offered by the broker. The selected assets are:
- Bitcoin/US Dollar (BTC/USD)
- Ethereum/US Dollar (ETH/USD)
- Litecoin/US Dollar (LTC/USD)
- Stellar/US Dollar (XLM/USD)
- EOS/US Dollar (EOS/USD)

Question 2
Create a market entry and exit strategy
Source
Entry and Exit strategies in trading are laid down rules created and followed by traders to ensure discipline and fact-based trading. These strategies can range from ways and when to use indicators, chart patterns, candles types, risk ratios, etc. And also indicate when to stay clear from trade setups.
Trading strategies depend on the individual. Traders develop strategies based on how they understand price movement and choose to react to it. It is very subjective and tailored to suit the individual personality.
My strategy
I use confluence-based trading strategies, it is a combination of various factors like market structure, candlestick analysis, indicators, chart patterns, and sometimes fundamental analysis, aligning to yield a trade setup. This style generally has a high profitability ratio depending on timeframe and risk appetite.
Entry strategy
My trade entry criteria include:
1- clear directional bias:
is the market trending or ranging? If it is trending, what is the trend, and is the market structure maintained? And If it is ranging, does it have enough bound (points) to allow for trades.
2- Confluences
Do the indicators and market structure align? Trading volume is the last couple of hours, chart patterns, and candlestick analysis.
3- Risk to Reward (Take Profit & Stoploss)
Based on the setup, what's the best least risk to reward ratio? I use at least 1: 1.5, for instance risking $50 to earn $75 per that trade.
4- Risk Management
What percentage of invested capital is to be risked per trade? I risk 3-4% per trade. This helps maintain a healthy balance in events of bad trades.
Exit strategy
My exit criteria include:
1- Take Profit
The profit target price, usually in a higher ratio to the risk. This method of exiting indicates that the trader earned profits.
2- Stoploss
The close trade price, usually in a lesser ratio to reward. This method of exiting results from encountering losses.
3- Trade Invalidation
This method of exiting occurs when a trade idea is invalidated, usually results in the manual early close of trade either in profit or in a loss.
Illustration of entry and exit criteria
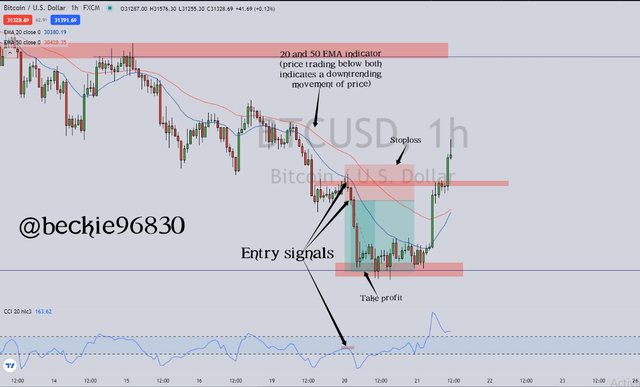
The trade below satisfied my entry and exit criteria.
Bitcoin/USD 1 hour chart
Entry
In the above chart, the trend was a clear downtrend with the formation of lower high and lower lows, confirmed by both market structure and the EMA indicator (the EMA indicates dynamic resistance and support areas). The commodity channel index (CCI) indicator shows that price is still within the neutral territory which means there is potential for further movement downwards before reaching oversold regions.
Price touched and rejected the EMA, the EMA, and candlestick pattern formation confirmed trend reversal after the minor up movement.
Exit
The stop loss and take profit were set in a ratio of 1: 2 and in line with areas of the previous market structure depicted by the blue horizontal line.
please note: both profit target price and Stoploss price can be trailed to increase profit potentials.

Question 3
Use the signals of the Commodity Channel Index (CCI) to buy and sell the coins you have selected
Source
please Note: for this demonstration, I used only the CCI indicator signal, as per instruction given.
Trade 1- BTCUSD Daily Chart
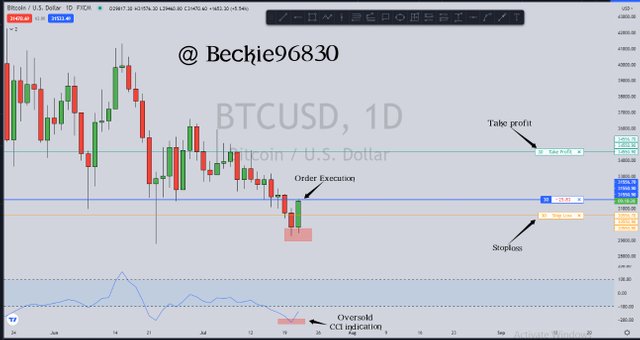
In the above chart, the commodity channel index indicated that price is in an extremely oversold region under the -100% mark. The oversold level has been respected three times (price bouncing off the region to the upside).
I executed the trade after seeing an upward market structure on lower time frames, with a 1 : 3 risk to reward ratio. I executed multiple times on this setup.
Trade 2- LTCUSD Daily chart
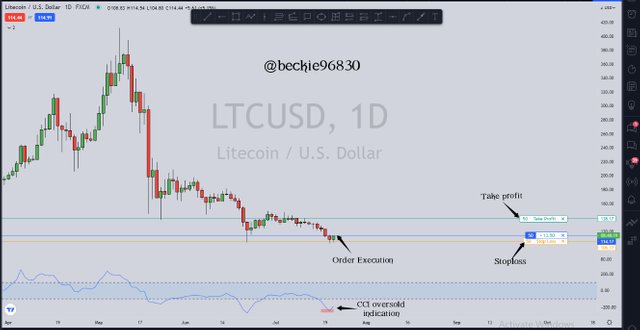
In the above chart, the commodity channel index indicated that price is in an extremely oversold region under the -100% mark. The oversold level has been respected twice (price bouncing off the region to the upside).
I executed the trade after seeing upward market structure on lower time frames, with a 1 : 3 risk to reward ratio.

Question 4
Declare your profit or loss
Source
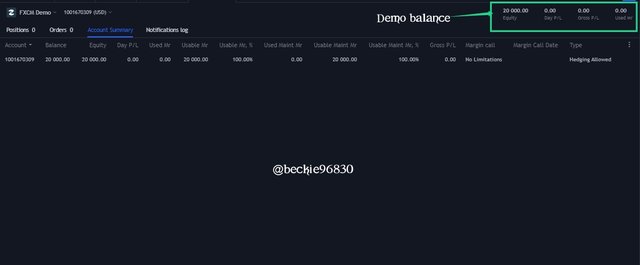
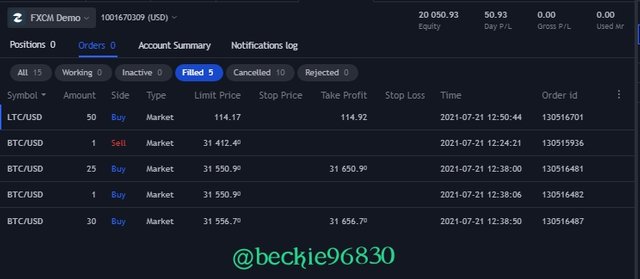
A profit of $50.93 was actualized from the traded positions of BTCUSD and LTCUSD. As shown in the image below, the account summary reflected the $50.93 gain in the Daily profit/loss column (P/L) and the account equity.
The account was opened with a balance of $20,000, as mention above a profit of $50.93 was made bring equity to $20,050.93


Question 5
Explain your trade management technique
Source
The stoploss and take profit prices of the trade were set in ratios of 1:3 respectively, but I manually closed positions of both trades. This is because the setup was seen on the daily time frame and would be time to play out.
And another contributing factor is that price was trading under the 20 and 50 EMAs on the daily timeframe, which was in contrast to what the CCI indicator showed. I executed for clarity and proper understanding of the concept taught in this lesson.
I can say that the CCI indicator shows price reversal signs early, but the signal should be confirmed when the other indicating factors align.

Conclusion
Market reversals are important transitions in the phases of price movement. It indicates a shift in market sentiment and provides opportunities for traders to capitalize on.
Indicator tools like CCI and EMA used with price action are used in identifying trend reversal, allowing interested investors to invest at appropriate times.
Thank you professor @asaj for this insightful lesson. It is highly appreciated.
Good job @beckie96830!
Thanks for performing the above task in the fourth week of Steemit Crypto Academy Season 3. The time and effort put into this work is appreciated. Hence, you have scored 7.5 out of 10. Here are the details:
Remarks:
You have done a good job Becky. You clearly understand the topic and could have earned more points had you analysed five coins in Task 3. Also, your account summary had two of the five coins you selected. We were looking forward to see more from you.
Again, thanks for the time and effort, and for sharing your market entry and exit strategy with us.
Downvoting a post can decrease pending rewards and make it less visible. Common reasons:
Submit
Thank you professor @asaj I will improve on my next assignment
Downvoting a post can decrease pending rewards and make it less visible. Common reasons:
Submit