 edited using pixellab
The crypto space is very vast and there are numerous numbers of tools that can be used to determine various activities in the market. Tools such as the Fibonacci retracements Which was a discussion for the Steemit Crypto Academy Contest last week. We saw how this tools can be used to determine entry and exit points by traders in the market, the advantages and disadvantages...
This week, the contest is centered on exploring STEEM/USDT trading dwelling deeply on technical analysis, trading analysis, risk management, fundamental analysis and leading indicators. Join me as we explore the STEEM/USDT trading....
TECHNICAL ANALYSIS
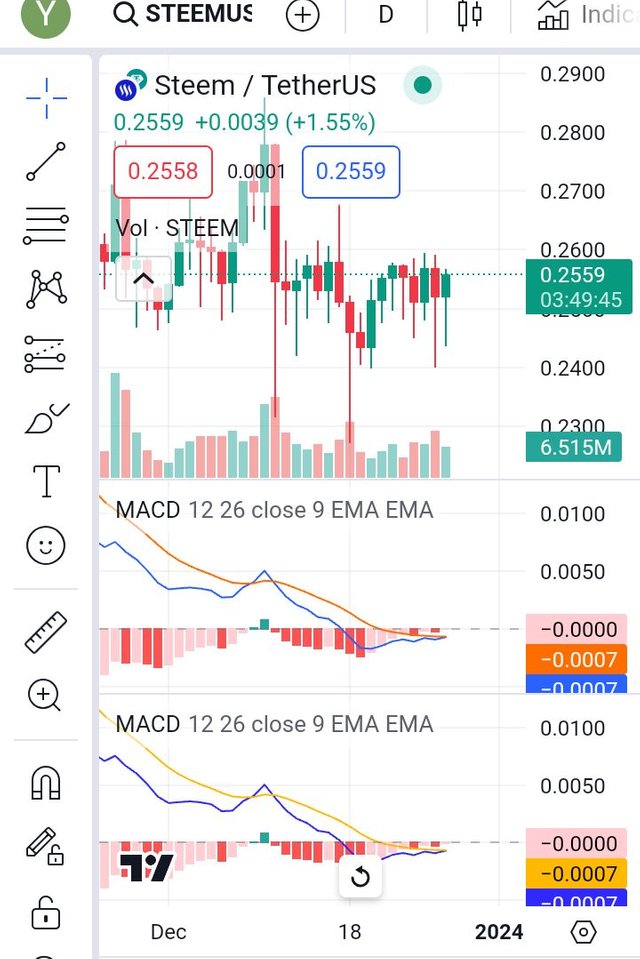
First of all, the MACD or Moving Average Convergence Divergence, is a technical indicator that is used for the identification of trend changes in the price of a cryptocurrency. It is simply calculated by subtracting the longer-term moving average and the further result is therefore plotted on a chart (pair). Traders uses the MACD indicator to check out or spot potential selling and buying opportunities as well as trend changes/reversals.
screenshot from trading view app
For the STEEM/USDT pair, to identify a buy or sell signal using the MACD indicator, you would simply look for a crossover of the MACD line and the signal line.
The MACD indicator has three main lines. First is the MACD line, that is plotted in blue or black, which is the difference between the 12-period and the 26-period exponential moving averages. The second one is the signal which is a 9-period exponential of the MACD line which is plotted in red.. The third is he histogram, a visual representation of the visible difference between the MACD Lina and the signal line and it is usually plotted in red or green where red indicates downward trend and green indicates upward trends. Different platforms may use different colors so be sure to Check the software settings...
Back to the main question!
To identify a buy or sell signal on the STEEM USDT pair, like I earlier said you would look for a crossover of the MACD line and the signal line. When the MACD line is above the signal line it could be interpreted as a buy signal while the opposite (if the signal line is above the MACD line) it is considered as a sell signal.
In the image above you could clearly see the signal line is above the MACD line which can be interpreted as a sell signal. True to that interpretation, now is a good time to sell your STEEM tokens. Also in the chart, it is noticed that there are more sell signal than buy signals since the signal line is constantly above the MACD line.
Second question (Bollinger bands)
screenshot from trading view app
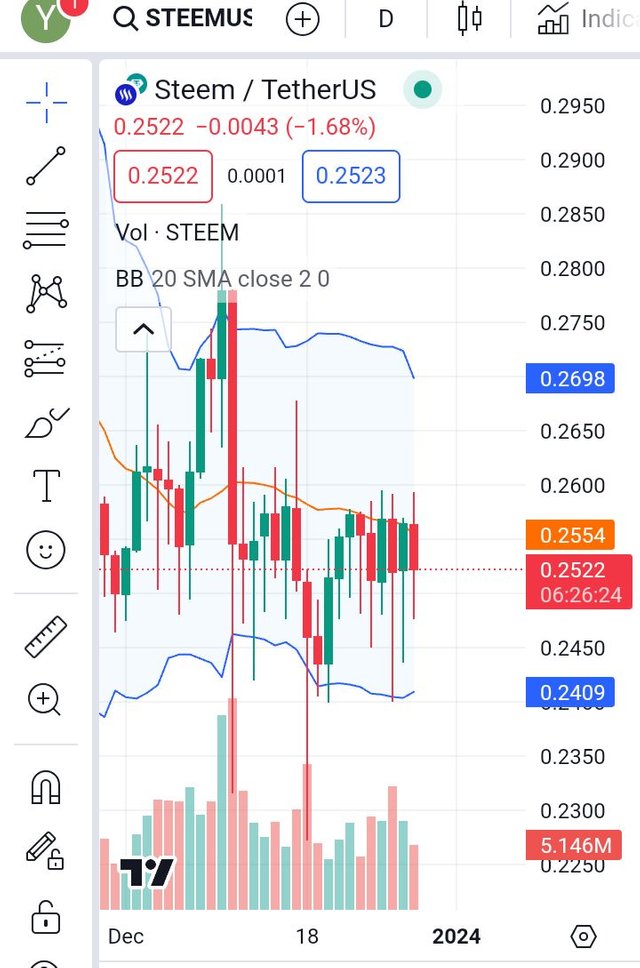
For the Bollinger bands, this indicator, indicates two things from two bands. The upper band indicates an overbought condition, while the lower band indicates an oversold condition. It is very important to note that these are just signals and researched and analysis should always be carried on.
There are three bands ; upper, middle and lower bands. The middle band is the simple moving average (SMA) of the price for a certain period of time, calculated usually 20 days. The upper is a set number of standard deviation above the SMA likewise the lower band is a set number of standard deviation below the SMA. So, the standard deviation is the statistical measure of how much a set of values changes from the average value which shows that the upper and lower bands indicates how much the prices varies above or below the SMA.
In the STEEM USDT pair, the upper band (in blue) indicates 0.2698 as the price change above the average price indicated by the middle band (in orange) as 0.2554. The lower band (in blue) indicates 0.2409 as the price change below the average price. The simple average of the STEEM price indicated by the middle band is 0.2554. This simple moving average is calculated usually 20 days
Trading Strategies
 screenshot from trading view app
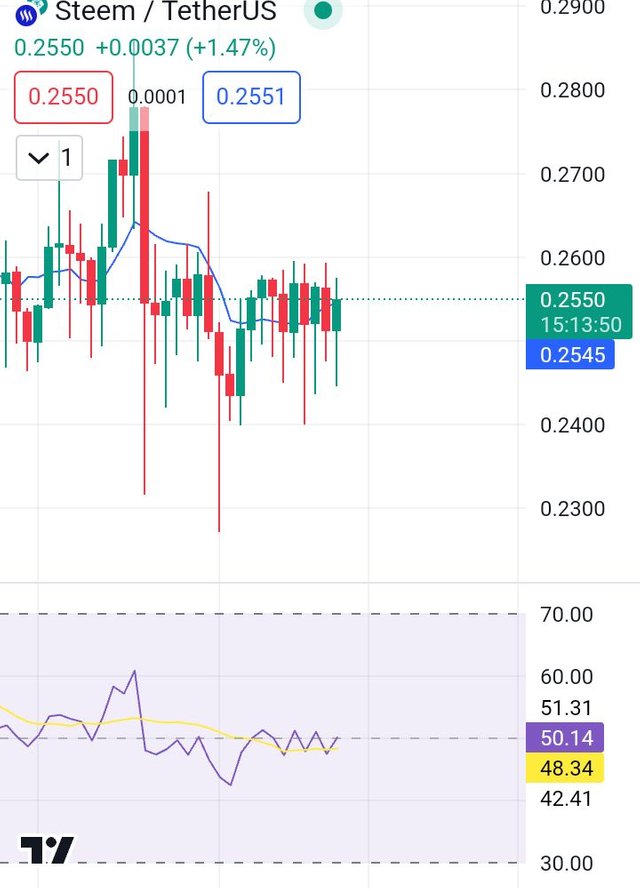
Combining the RSI and moving average is a popular trading strategy or technique known as the "RSI crossover strategy". In this strategy, the RSI is usually used to spot an overbought and oversold condition while the moving average is used to make confirmation of a trend.
The combination of these tools (RSI and moving average) can be good enough to determine entry and exit points in the STEEM USDT pair. The RSI is used to measure momentum and the MA tracks the average price over a given period of time. When the RSI crosses above the MA it can indicate a selling signal/opportunity.
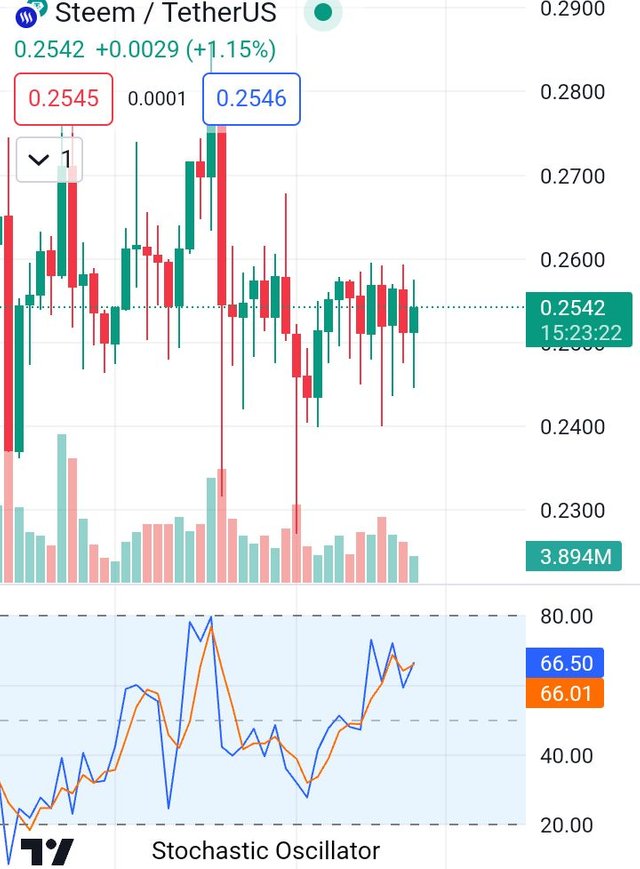 screenshot from trading view app
For the Stochastic Oscillator, a bearish trend can be indicated by a reading below 20, while a bullish trend can be indicated by a reading above 80. In the STEEM USDT chart above, the current reading of the Stochastic Oscillator, is 66.50, 66.01 which definitely indicates a neutral state that means neither a buy or a sell signal is present..
Risk management
Setting a stop-loss is a very important part of risk management as a trader when trading any cryptocurrency pair. In trading the STEEM USDT pair, it helps to limit your losses in case the market eventually goes against you. This is also applicable to other pairs.
To set the stop-loss, there are few different way to do so! One way is to use the resistance and support levels identified by technical analysis. The other option is to make use of a percentage based stop-loss such as the 5% or 10%...
It is very essential to diversify positions when trading the STEEM/USDT pair for few important reasons.
- It can help to reduce your overall risk. This means not putting all your eggs in one basket so to not get all almost all broken.
- It helps to increase your chances of making profit, as you may be able to take advantage multiple opportunities in the market.
- Lastly, it helps to minimize potential losses if the market/one position goes against you...
Applicable to all other cryptocurrency pairs too.
Fundamental Analysis
The most important fundamental factor one should consider when taking a position in STEEM/USDT is the inherent fundamentals of STEEM itself. This includes factors like the adoption, network's development and use cases. These fundamental factors can help one take a long or short position on the STEEM/USDT pair as a trader....
There can be significant impact on the price of STEEM/USDT by external events. For instance, if there is positive news announced about the development of the STEEM network, this could definitely lead to an increase in the price of the STEEM token. In addition, negative news about STEEM or stablecoins could lead to a decrease in the price of STEEM/USDT.
So it is important to be updated with latest news and new development related to both stablecoins and STEEM. This can help us to make informed decisions about taking long or short position in STEEM/USDT. Also technical analysis of the market can give further insight on the current and potential future trend and price movements.
Leading indicators
Of course yes, there are few other indicators that can be used to analyze the STEEM/USDT pair...
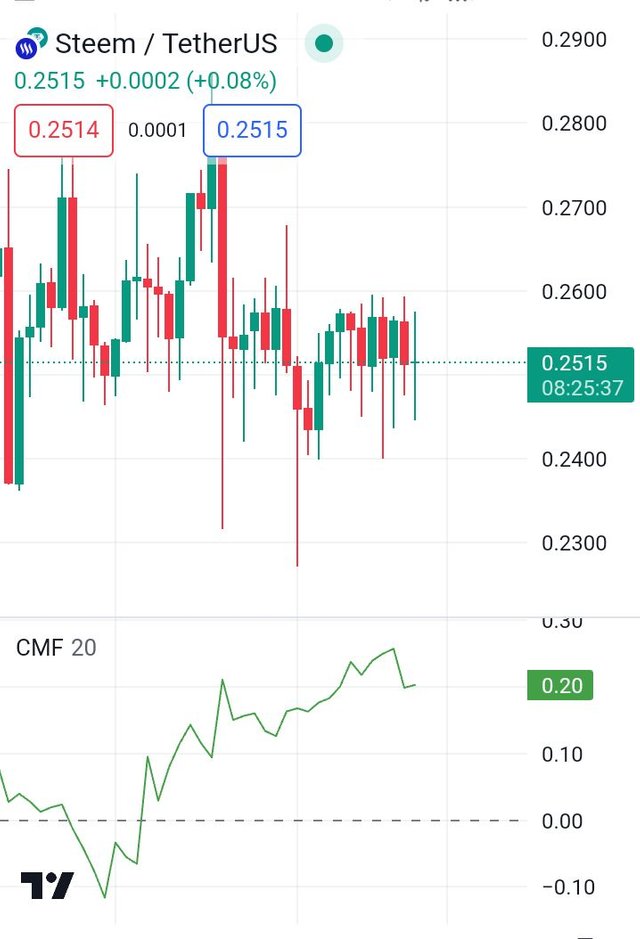 screenshot from trading view app
One of them is the Chaikin Money Flow (CMF) indicator, that measures the in-flow and out-flow of money from the market. This indicator can help one to identify potential turning points and trends in the market ...
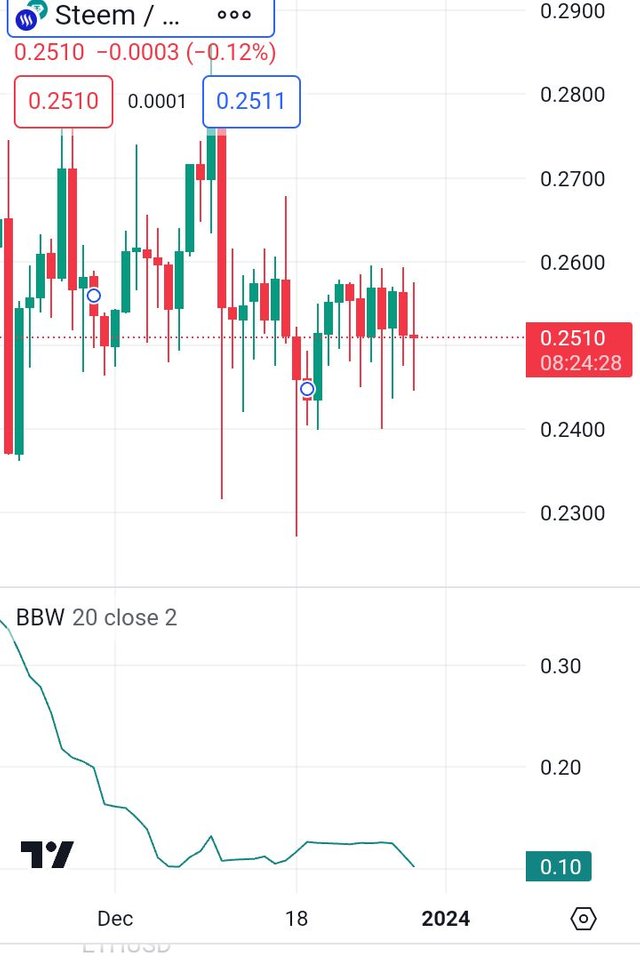 screenshot from trading view app
Another one is the BBW(Bollinger Bands Width) indicator which measures the volatility of the market. This indicator can be of help to identify potential reversals and breakouts....
Finally, Trading Volume can be used to predict future movement by the analysis of the relationship between the price and volume. In general, an increase in volume, alongside with a rise in price is considered bullish. While a decrease in the volume accompanied with a falling price, it is considered bearish.
So if the volume of STEEM goes high along with the price then it is considered as bullish while if the volume goes low with the price, it is also considered as bearish. So analysing the relationship between the price of STEEM and the volume, it will help to predict future movement...
In conclusion, exploring the STEEM/USDT trading, technical analysis, trading strategies, risk management, fundamental factors and leading indicators are necessary to be considered to fully know about the nature of the STEEM/USDT pair.
Also, market conditions and event can have significant impact of the price of STEEM USDT so always get up to date with the latest information on the official cryptocurrency of Steemit. With all these strategies combined, a good and informed decisions can be made to increase our chances of success...
Thanks for reading..
I invite @bossj23, @uduak01 and @sbamsoneu
Thank you, friend!


I'm @steem.history, who is steem witness.
Thank you for witnessvoting for me.
please click it!
(Go to https://steemit.com/~witnesses and type fbslo at the bottom of the page)
The weight is reduced because of the lack of Voting Power. If you vote for me as a witness, you can get my little vote.
Downvoting a post can decrease pending rewards and make it less visible. Common reasons:
Submit
Upvoted. Thank You for sending some of your rewards to @null. It will make Steem stronger.
Downvoting a post can decrease pending rewards and make it less visible. Common reasons:
Submit
My dear frin you have defined so well MACD that a simple person can also get better understanding of it and you have done justice to each and every question and that's reaosn you have been so answered well
Downvoting a post can decrease pending rewards and make it less visible. Common reasons:
Submit
Has hecho un gran esfuerzo por abarcar todas las preguntas desafío, dejando claro el uso de los indicadores para el análisis técnico.
Por favor actualiza la etiqueta por #criptoacademia-s14w5 ya que no te encuentras visible. Tal vez por eso nonhan veriricado tu post de hace 3 días.
Saludos y mucha suerte.
Downvoting a post can decrease pending rewards and make it less visible. Common reasons:
Submit