| Grading Basis | Score |
|---|---|
| Content Structure | 1.5/2 |
| Originality | 1.5/1.5 |
| Clarity of Language, Understanding of the Context | 1.5/2 |
| Compliance with the Topic | 1.5/1.5 |
| Quality of Analysis | 1/2 |
| #club5050 | 1/1 |
| Total | 8/10 |
Feedback/Suggestions
Your effort on this is quite great. Always try to use proper headings instead of quote questions.
You have shown your understanding of OBV even with a great illustrative example.
Nevertheless, there are a few things to point out on some of your charts.
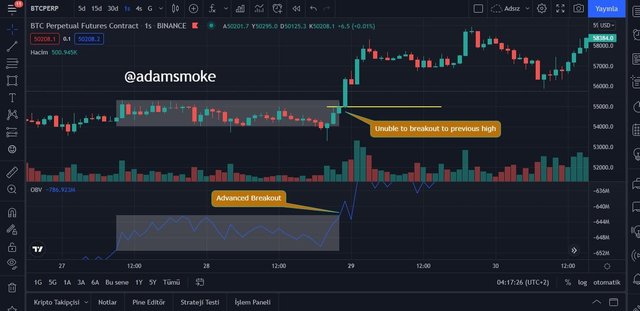
Your advanced bullish breakout chart can be better, I would have loved it if you had used another chart in that part of the task. The OBV line broke the previous high and returned sharply to break below the breakout again. A chart where the break stays above the breakout for some time would have been great. Take note of that.
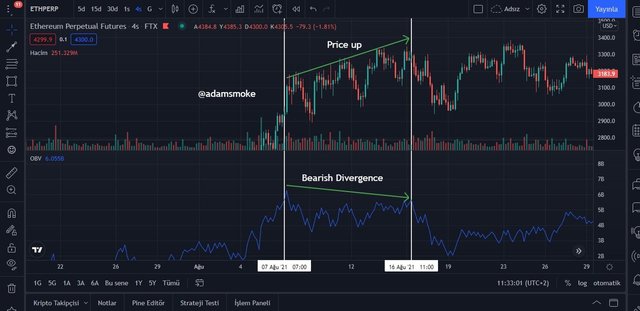
The chart above dented your understanding of bearish divergence with OBV. From the point your marking starts from till where it ended, the lower highs are not consistent, as such, that chart is wrong.
Your trades are quite good.
Overall, great effort. Take note of the corrections above. Thank you.
Total| 8/10

