Hello fellow steemians this is my assignment post for professor @kouba01
Discuss your understanding of Kumo, as well as its two lines. (Screenshot required)
What is the relationship between this cloud and the price movement? And how do you determine resistance and support levels using Kumo? (Screenshot required)
How and why is the twist formed? And once we've "seen" the twist, how do we use it in our trading? (Screenshot required)
What is the Ichimoku trend confirmation strategy with the cloud (Kumo)? And what are the signals that detect a trend reversal? (Screenshot required)
Explain the trading strategy using the cloud and the chikou span together. (Screenshot required)
Explain the use of the Ichimoku indicator for the scalping trading strategy. (Screenshot required)
Conclusion:

Q1. Discuss your understanding of Kumo, as well as its two lines. (Screenshot required)

The Kumo commonly referred to as Ichimoku Kinko Hyo is a technical analysis indicator that does not only reveal the market prices, trends, support, and resistance it also predicts to some extent the direction of price trends where it will be in the future when to exit and more, the chart although a little bit complex offers lots of information from just a glance on the chart. The Ichimoku Kinko Hyo translated in English means Ichimoku= One glance, Kinko = Balance and Hyo stands for Chart is a chart developed in the 1930s by Goichi Hosoda with the sole purpose of displaying more pieces of information on a chart like entry and exit signals, support and resistance, and momentum in just a glance.
USES OF KUMO
- Stop loss
- Entry and Exit Signals
- Price trends
- Predict market price etcetera
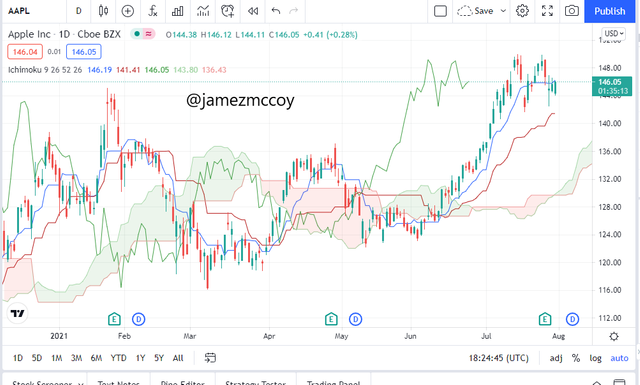
The cloud is formed in between these two lines Senkou span A and Senkou span B
Senkou span A
The Senkou A also referred to as the leading span A is a line that forms the top of the cloud which is basically gotten when one takes the tenkan san(Fast moving average) which is a total of 9 periods averaged out with the Kijun san (Slow moving average) which is a total of 26 periods and what this does is it gives you the price action in the market from the past 14 periods. The senkou span A works in hand in hand with the senkou span B and due to the fact about how it is plotted it responds much more quickly to market price changes, when the Senkan Span A is seen to be above the cloud it indicates that the market is in a bullish trend on the contrary when it is seen beneath the cloud it indicates that the market is in a bearish trend

- Senkou Span B
The senkou span B is a line that is formed beneath the Cloud and it is Plotted usually by averaging the highest highs from the last 52 market movements/periods and the lowest low of the last 52 period, this Span also like the counter part works hand in hand with the other Senkou span to form the cloud and measure price momentum and also to indicate support and resistance level. If the Senkou Span B is seen on top of the cloud the trend is then considered to be a Bearish trend and vice versa
52High + 52Low/2 = Senkou span B


@2. What is the relationship between this cloud and the price movement? And how do you determine resistance and support levels using Kumo? (Screenshot required)
From my understanding, the Kumo clouds can and the price movement can be relatable to each other in the sense that they both give a general sense of market trends when one glances at the chart he can from both perspectives I.e the cloud and the price movement tell in what direction the market is going
Another relationship we can find between the cloud and the price movement is seen when they go around each other indicating different signals for instance when we see or observe the cloud to be below the market price an Upward movement in the market trend is usually what follows i.e a bullish trend and on the contrary, if the cloud is observed to be above the market price a downward trend in price movement is usually what follows i.e a bullish trend

The Kumo's traditional support and resistance level take quite a different approach than other indicators do, how thick or thin the space between Span A and B indicates market/price volatility I.e if the cloud is thick(widely apart) this indicates high resistance and support in the market which in turn says that the market prices should be expected to continue in the current trend it is currently on the contrary if the Kumo cloud is seen to be thin(closely together)it indicates low volatility which means the support and resistance level is not very strong which in turns say that market price is not to be expected to follow a specific pattern and in some cases of thin clouds prices tend to penetrate the Kumo clouds.


(Q3) How and why is twist formed? And once we have "seen" twist, how do we use it in our trading?

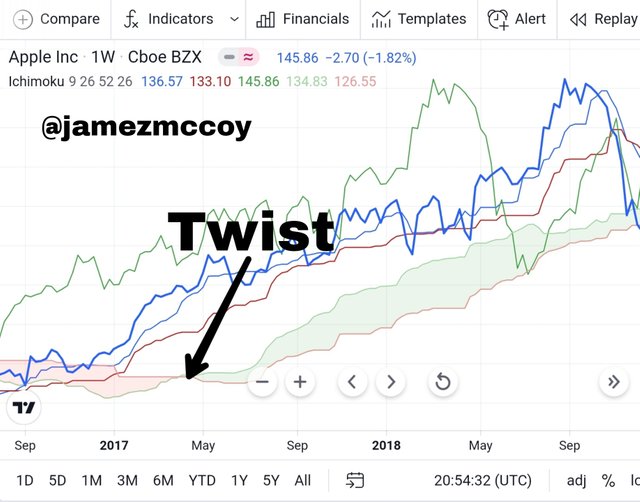
In most cases of thin Kumo clouds there the highest probability of seeing a twist in the indicator can be seen, A TWIST in the cloud is seen when the Senkou span A crosses over the senkou span B and this occurrence in the indicator is mostly instigated by price changes either towards a bullish direction or towards a bearish one. The major indication or signal a twist sends to one observing the chart is in most cases a change in direction of price flow, below are some instances of a bullish and bearish Kumo twist

Question 4: What is the Ichimoku trend confirmation strategy with the cloud (Kumo)? And what are the signals that detect a trend reversal?
TWIST
the Ichimoku is a technical analysis tool with lots of features and lines, the twist signals, in this case, can serve as a trend confirmation signal in that usually immediately after a twist is formed in the Kumo cloud a change in market price is always expected to follow, In this case, if there is they have been a bearish trend and you know a bullish reversal is expected to follow and a twist forms in the indicator towards a bullish direction that is a confirmation signal that the market prices is expected to reverse.

CHIKOU SPAN
The chikou span also known as the lagging span is usually plotted 26 periods in the past on the chart, whenever the span is seen below the market prices it indicates a bullish trend so if a trader plans on riding a bullish trend and see the span beneath the market prices this sends a confirmation signal to the trader that the market will be going in a bullish direction and on the contrary when the Chikou span is seen above the market prices this indicates that the market is going in a bullish direction and downward flow of price should be expected to follow

CLOUD FLOW
This information is perceived from just a glance on the chart one can use the direction of the cloud flow to confirm or tell if a market is going to be in a bullish or bearish trend when the Senkou span A and B are both moving downwards this sends a signal to a trader or confirms a traders chart interpretation that the market is going to go in a bearish trend

Question 5: Explain the trading strategy using the cloud and the chikou span together.
The cloud and the chikou can both be studied closely in a chart by a trader to form a strategy, for instance, you set your target that you will only enter a trade if a market price flow is being strongly supported by the cloud that only when a strong resistance and support level is displayed only then will you enter a trade. Strategy as we know is patterns we lay down mentally or physically to maximize our profit intake in the trading world. In a nutshell, the major strategy that can be established using the Cloud and the Chikou span can be gotten with conditions like
- A trader only enters a bullish trend market when the chikou span above the cloud and market price

- A trader only enters a bearish trend if the chikou span is beneath both the price and cloud

This is a typical strategy some traders use while using the Ichimoku indicator.

- Explain the use of the Ichimoku indicator for the scalping trading strategy. (Screenshot required)
A scalp trader is usually one who looks to take profits as often as possible over a short term period, and the Ichimoku indicator gives a lot of information from just a glance so for someone looking to utilize time and maximize profit a strategy with Ichimoku would be very efficient in that it works with short time frames like 5 mins 10 mins etc.
Uses of Ichimoku in scalp trading strategy
With the Ichimoku indicator strategies like using the cloud to determine entry and exit points in trades can be established in scalp trading
The Ichimoku indicator can tell a scalp trader with the help of the Senkou and the Kumo cloud the direction of a market trend
In strategies established for scalp trading every second waisted could mean loss or gains the Ichimoku indicator helps saves time by transmitting a lot of information at once
We can absorb a lot of information from just glancing at the chart, the ability of the Indicator to project so much information is crucial to a scalp trader

CONCLUSION
The Kumo cloud is a very important aspect of the Ichimoku Kinko Hyo and with its help, a trader can to some extent determine the direction of price flow and a lot mire other information from just glancing at the chart. Knowledge is power in cryptocurrency the more information an individual has the more likely he is to succeed in a trade. Thanks professor @kouba01 for this amazing kecture i hope i attempted most of the questions to your satisfaction

Hello @jamezmccoy,
Thank you for participating in the 5th Week Crypto Course in its third season and for your efforts to complete the suggested tasks, you deserve a 3.5/10 rating, according to the following scale:
My review :
A good and deep explanation of the two lines of the Kumo cloud with a lack of interpretation of the cloud itself.
As for the relationship of this cloud to the price movement, it can be determined according to the thickness of the cloud, where the higher the density of the cloud, this indicates the high volatility of the market in that period. The increased price movement and its volatility will lead to the divergence of the two lines, which gives us the impression of stronger fluctuation in the price movement.
Your interpretation of trading using the twist technique was not clear and did not address all possible cases.
The fourth question guarantees correct information but lacking deepening the analysis of the answers.
The same for the rest of the answers, where the information was presented without explaining or analyzing it.
Thanks again for your effort, and we look forward to reading your next work.
Sincerely,@kouba01
Downvoting a post can decrease pending rewards and make it less visible. Common reasons:
Submit