
Greetings to you my honourable professor @fredquantum and to you my Dear readers of this post. Indeed, I'm feel with joy today, to present my homework task that was given by professor@fredquantum on the topic: "Crypto Trading Strategy with Triangular Moving Average (TRIMA) Indicator".
1. What is your understanding of the TRIMA indicator?
The words TRIMA Indicator is an abbreviation of Triangular Moving Average Indicator which is a representations of an average of prices, but places more emphasis weight on the middle prices of the time period in the chart. In a very simple understanding TRIMA Indicator is simply a moving average based Indicator that is mostly a double smoothed simple moving average (SMA) that deals with the smoothing of data in order for a clear trade signal to be presented during the the time of volatility.
The TRIMA Indicator creates a simple moving average (SMA) that doesn't react to market volatility quickly, consequently, response to filtering out the noise of the price of the traded asset and leading to the direction of the original trend of the traded asset. In the TRIMA Indicator, when the fast moving average (MA), has crosses that of the slow MA upwards, the price of the traded asset can begin a bullish trend moved, and it's a sign of buy signal. However, when it's in an opposite direction to what I have just said, that is when the fast MA crosses the slow MA downward, the price of the traded asset will begin bearish trend movement. At this point is a sign that sellers are in control of the market.
The SMA which is known as simple moving average is the Indicator that opens the basis to **Triangular Moving Average (TRIMA), the simple moving average presents its value the average price of the traded asset over a given a period of time and the oscillating line move inline with the price of the traded asset on the chart to present itself well due to the average value. As I have earlier said above, TRIMA create a simple moving average, which means that it's a smoothed version of the SMA that is averaged twice in such a way that it doesn't react to quickly to market volatility (i.e the movement of price), as the moving average that is early enough.
Although, the TRIMA Indicator can be regarded as double smoothed based on its double average of the price of the traded asset in such a way that its line is presented more clearly.
Key significant of TRIMA Indicator
In TRIMA Indicator, the price of the traded asset over a given period of time is double average to abolish (eliminate) a quick reaction to the price of the traded asset.
TRIMA Indicator, give a more clearer trend signals which is the best feature that trend traders likes.
It doesn't quickly react in crypto markets that is highly volatile.
Traders can used TRIMA to trade reversals by combining other Indicators like the SMA to place either a buy/sell order.
2. Setup a crypto chart with TRIMA. How is the calculation of TRIMA done? Give an illustration. (Screenshots required)
Here I will be discussing on how TRIMA Indicator can be setup on a crypto chart, using TradingView.com, where I will be showing you the steps.
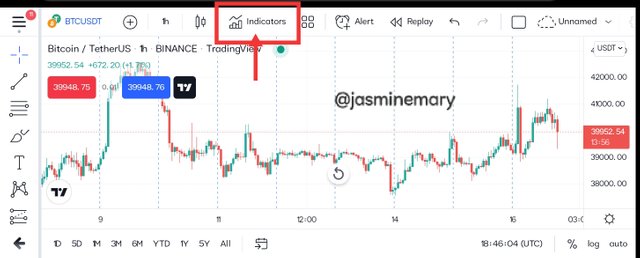
Step 1: I go to TradingView.com, and on the landing page, I then clicked on Indicator at the top of the landing page as shown from the screenshot below.
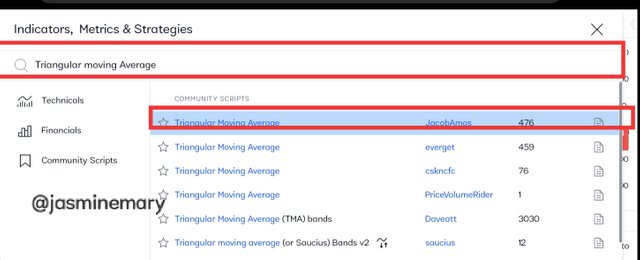
Step 2: After clicking Indicator, I then searched for Triangular moving average before I then selected it as shown from the screenshot below.
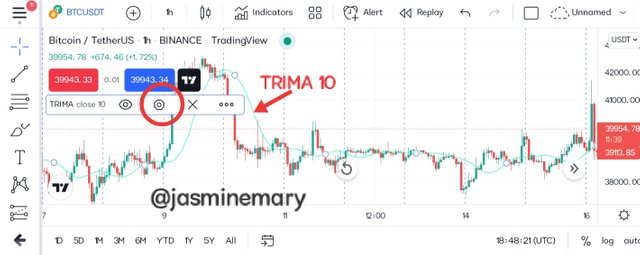
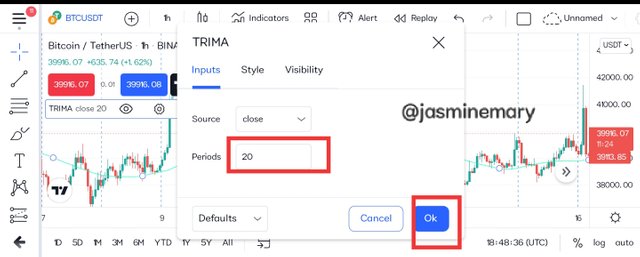
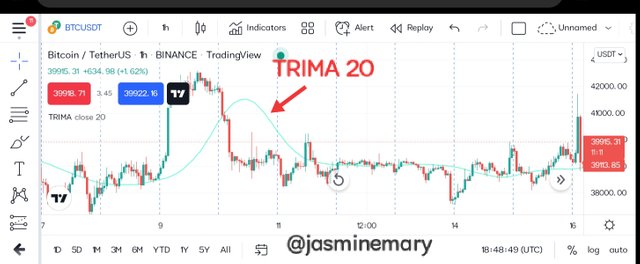
Step 3: After selecting TRIMA from the above image, the Indicator then added to my chart, which I then click on the setting icon and which I then changed the length of the TRIMA Indicator to 20 periods for a more clearer and better Indication. Below is the screenshot of the Indicator which is set as 20 periods.
How to calculate TRIMA Indicator
TRIMA Indicator as I have earlier said, is the average of an average , of the last prices of the traded asset (i.e N price (P). In order to calculate the TRIMA Indicator, the first thing to calculate is SMA using the formula below.
SMA = (P1 + P2 + P3 + P4 + P5 ... PN)/N.
Where:
P1, P2 to P5 = The price of the traded asset at the 5 periods continuously.
PN = The price of the traded asset at the last period that is under consideration.
N = Total Number of Periods that is taken into consideration.
After calculating your SMA above, the next is to insert the values of all the SMA into the formula to get your TRIMA values, using the formula below.
TRIMA = (SMA1 + SMA2 + SMA3 + SMA4 + SMA5 + ...SMAN)/N
The TRIMA formula above, can also be expressed as:
TRIMA = SUM(SMA VALUES)/N.
3. Identify uptrend and downtrend market conditions using TRIMA on separate charts.
In crypto trading we all know and uptrend condition is when the price of the traded asset in moving upward which shows a higher highs and a higher lows. However, in TRIMA Indicator it's somehow differnent to identify. An Uptrend condition of TRIMA is usually seen when the price of the traded is at the top of the TRIMA Indicator, without both the price and TRIMA entering each other.
This means in an Uptrend market, using TRIMA, is Identify, when the price of the traded asset have been clearly seen at the top of the TRIMA Indicator without the price of the asset and TRIMA entering one another. Let's us take a look at the screenshot on an uptrend market condition using TRIMA below.
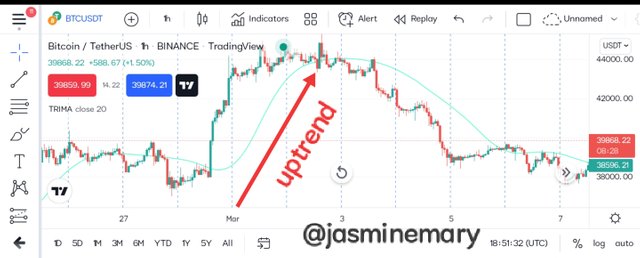
Looking at the screenshot above, on BTC/USDT chart, we can see that the TRIMA Indicator was angled upward and is below the price of the traded asset.
For a Downtrend market condition, TRIMA is usually seen when the price of the traded is under the TRIMA Indicator which is a sign of a downtrend movement characterise by lower highs and lower lows. (I.e downtrend market condition the price of the traded asset is seen under the TRIMA line). The downtrend market is a signals that traders are selling off their asset in other to take profit from the market. Let's us take a look at the screenshot on an uptrend market condition using TRIMA below.
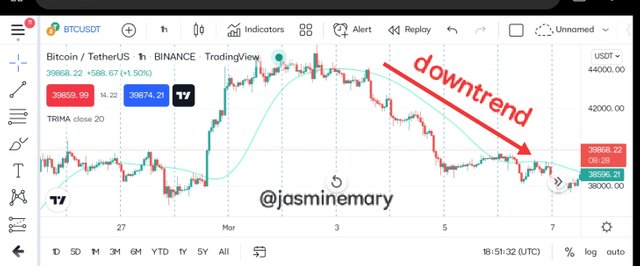
From the screenshot above, we can see that TRIMA Indicator was angled downward and is above the price of the traded asset.
4. With your knowledge of dynamic support and resistance, show TRIMA acting like one. And show TRIMA movement in a consolidating market. (Screenshots required).
The dynamic support and resistance,of TRIMA is a special signal that is received form SMA, TEMA, EMA and other Moving average (MA) average Indicators. All these affomentioned mentions Indicators are trend based Indicators that are apply on a chart to identify the trends of price movement in the market.
All the Indicators form a line that stands as a point for support and resistance levels to the trends of price of the traded asset that acted or retest the lines and continue in moving in the direction of the price.
TRIMA acting as a Support level
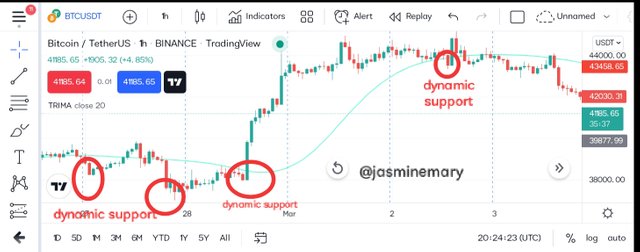
Here,the price trend of the traded asset and that of the TRIMA line move in an upward direction, with the trend at the support level retesting the TRIMA line which make its to be a dynamic support level. Let's take a look at the screenshot below.
TRIMA acting as a resistance level
Here the price of the traded asset and that of the TEMA line move in a downward direction, with the trend at the resistance level retesting the TRIMA line which make its dynamic resistance. Let's take a look at the screenshot below.
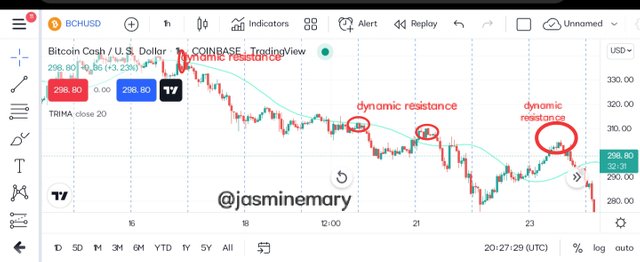
TRIMA movement in a consolidating market
Consolidating market is when the price of the traded asset enter a market when there is no clear difference between the uptrend and downtrend, (i.e there is no trend situation that can be Identify). In the consolidating market, you will see that TRIMA would be immersed within the price of the traded asset. The movement continue to exit before a break uptrend when the TRIMA Indicator line emerged below the price of the traded asset to confirm uptrend that is occuring. Below is a screenshot of what we are discussing about.
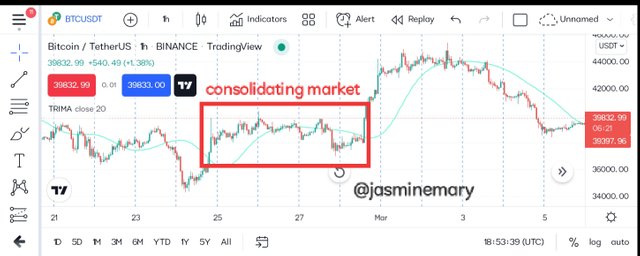
5. Combine two TRIMAs and indicate how to identify buy/sell positions through crossovers. Note: Use another period combination other than the one used in the lecture, explain your choice of the period. (Screenshots required).
Here I will be discussing about combination of two TRIMAs which is Buy crossover and Sell crossover. Let's get started.
Buy Crossover of TRIMAs
As we all know what the words crossover is when one thing cross over another thing. Here the Buy crossover of TRIMAs occurs when the TRIMA period that is shorter crosses over the TRIMa period, that is longer, which indicate an uptrend moved, which we all know that and uptrend moved on a chart is an indication that the market is trending which mesms buy entry can be place. Buy crossover of TRIMA can be done when you have understood your trade management so as to keep yourself in a safer zone.
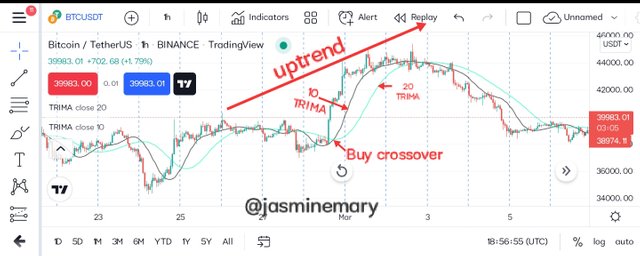
Looking at the screenshot above, which is a chart of BTC/USDT pair on 1 hour timeframe, you will see that I have combined two TRIMAs where I chose one TRIMA 10 as my shorter period and TRIMA 20 as the longer period. Looking at the chart we can see that the shorter period TRIMA 10 crosses over the longer period TRIMA 20 that began an uptrend movement, which can be seen as a buy order trade. Immediately, Identify the uptrend moved I then open a buy order trade.
Sell Crossovers of TRIMAs
As for the sell crossover of TRIMAs is when the TRIMA period that is longer crossover the TRIMA period that is short, which indicate a downtrend moved, which will all know that a downtrend moved on a chart is an indication that a sell order trade can be opens.
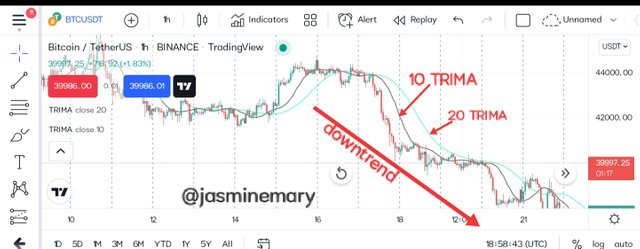
Looking a the screenshot above, on a 1 hour timeframe of BTC/USDT chart, we can see that the longer period TRIMA 20 crossed over the shorter period TRIMA 10 which is a sign of a downtrend moved, I then open a sell order trade.
6. What are the conditions that must be satisfied to trade reversals using TRIMA combining RSI? Show the chart analysis. What other momentum indicators can be used to confirm TRIMA crossovers? Show examples on the chart. (Screenshots required).
The conditions that must be satisfied to trade reversals using TRIMA combining RSI are conditions that need to met the requirements of bullish reservesal and bearish reversal.
Bullish Trading Reversal using TRIMA + RSI
Trading bullish trend reversal using TRIMA+RSI, requires some standards which are as follows;
The two TRIMA period of 10 and 20 TRIMA on the chart should be added together at different periods, and also RSI should be added.
In a consolidating market, or a downtrend movement, the Relative strength index (RSI) must reach the oversold level which is connected with reversal.
Allow the shorter TRIMA 10 period to cross over the longer TRIMA 20 period. After you have waited for this condition to be fulfilled, then a buy entry position can be place after the confirmation of at least two (2) candlestcks.
For proper risk management. Stop loss should be set below the support level at the bottom of the crossover. As I have earlier said, for proper risk management,apply a risk reward ratio of 1:1 RRR. If it's your first your time of using TRIMA Indicator, but if it's not you can apply 1:2 risk reward ratio.
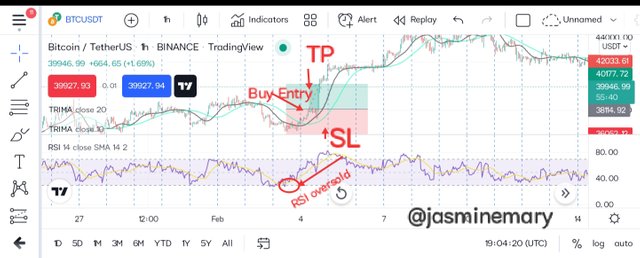
Looking at the chart above, we can see that price of the traded asset was in a consolidating movement,after a downtrend market moved. The Relative strength index (RSI) reached the oversold level before changing it direction which is Indicated on the chart above. From the chart again we can see that the TRIMA 10 period crosses over the TRIMA 20 period before I then opened a buy order trade.
Bearish Trading Reversal using TRIMA + RSI
For a bearish trading using TRIMA and RSI the same conditions that is required in bullish trading is the opposite of what is needed here.
The two TRIMA period of 10 and 20 TRIMA on the chart should be added together at different periods, and also RSI should be added
In a consolidating market, or an uptrend movement, the Relative strength index (RSI) must reach the overbought level which is connected with reversal.
Allow the longer TRIMA 20 period to cross over the shorter TRIMA 10 period. After you have waited for this conditions to be fulfilled, then a Sell entry position can be place after the confirmation of at least two (2) candlsticks
For proper risk management. Stop loss should be set above the resistance level at the top of the crossover. As I have earlier said, for proper risk management,apply a risk reward ratio of 1:1 RRR. If it's your first your time of using TRIMA Indicator, but if it's not you can apply 1:2 risk reward ratio.
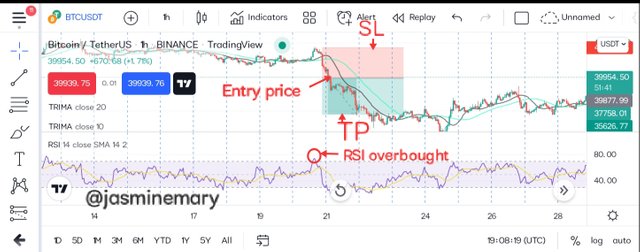
From the screenshot above, we can see that the price of the traded asset was in a consolidating movement, when the Relative strength index (RSI) reach the overbought level which is connected a trend reversal, before changing it direction which indicated on the chart above. From the chart we can also see that the TRIMA 20 period crosses over the TRIMA 10 period which signal a bearish reversal. After this, I then open a sell order trade.
7. Placee a Demo and Real trade using the TRIMA reversal trading strategy (combine RSI). Ideally, bullish and bearish reversals. Utilize lower time frames with proper risk management. (Screenshots required).
Here I will be executing my Demo trade TradingView.
WAN/BTC Buy
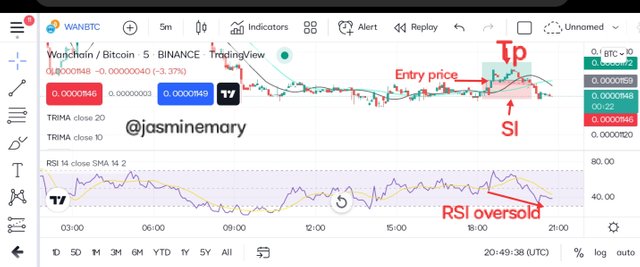
The above is a chart of WAN/BTC pair on 15minutes timeframe. Observing the chart I noticed that the price of the traded asset has a consolidating movement, and the relative strength index (RSI) has hit the oversold level. Looking at the chart again I saw that tee shorter TRIMA 10 period has crosses over the longer TRIMA 20 period before I then placed my Buy Entry immediately after the crossover. Using the following enteries;
Entry price: $0.00001148
Take profit: $0.00001223
Stop loss: $0.0001123
Below is the screenshot of the transaction history on my paper trade.

BTC/USDT Sell
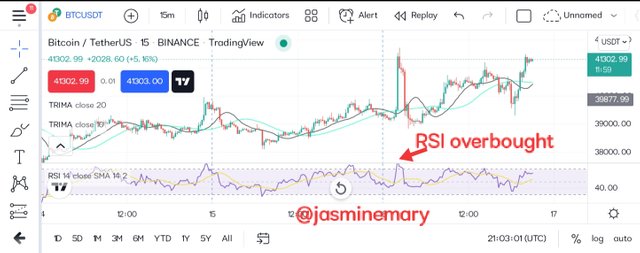
The above is a chart of BTC/USDT pair on 15minutes timeframe. Looking at the chart, I noticed that the price of the traded asset was consolidating when the RSI hit the overbought level which is connected to a trend reversal, and I equally observed that the longer 20 TRIMA period has crosses over the shorter TRIMA 10 period indicating a bearish reversal, which I then placed my Sell Entry using the following enteries;
Entry price: $40831.63
Stoploss: $40851.90
Take Profit: $40850.90
Below is the screenshot of the transaction history on my paper trade.

Real Trade
Here I will carry out my analysis on TradingView and execute the order on my Binance exchange.
XRP/BTC Sell
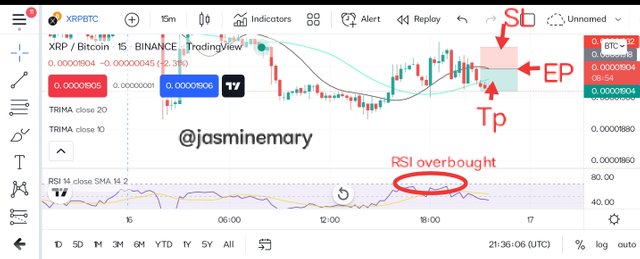
The above is a chart of BTC/USDT pair on 15minutes timeframe. Looking at the chart, I noticed that the price of the traded asset was consolidating when the RSI hit the overbought level which is connected to a trend reversal, and I equally observed that the longer 20 TRIMA period has crosses over the shorter TRIMA 10 period indicating a bearish reversal, which I then placed my Sell Entry and login to my Binance exchange and execute the trade
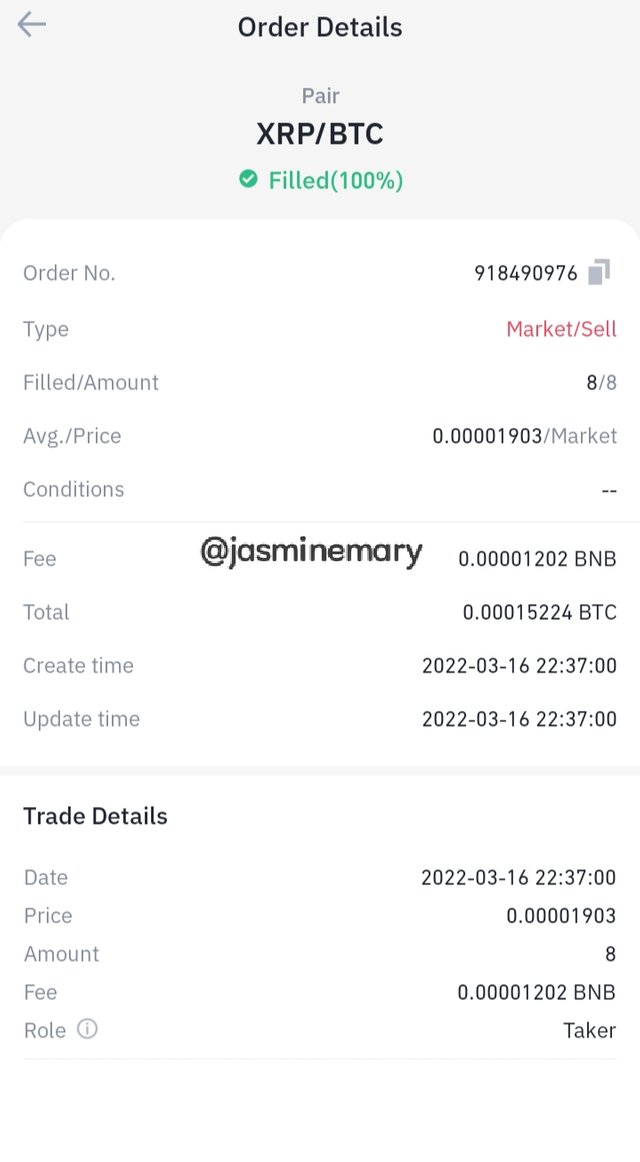
Below is the screenshot of my transaction history on Binance exchange.
8. What are the advantages and disadvantages of TRIMA Indicator?
| Advantages of TRIMA Indicator | Disadvantages of TRIMA Indicator |
|---|---|
| It doesn't react to vitality quickly since it a create a SMA that offer a smoothed line. | The Indicator is more exposed to false signals |
| It is more suitable and helpful to traders that which to enter into intraday swing highs and swing lows since is it change quickly. | The Indicator is something lagging. |
| It can be used as support and resistance for price trend. | When combined with other Indicators false signal can come up. |
Conclusion:
TRIMA response to late to price movement than simple moving average that respond quickly to price movement. The SMA is the basis that opens TRIMA Indicator and the Simple moving average is what represent it's value as an average price of the traded asset over a given period of time. All thanks to professor @fredquantum for his self-explanatory lesson.
Thank you for reading
Cc:-
@fredquantum
