Hey everyone, welcome to another week in the season 3 of the Steemit Crypto Academy. I want to specially appreciate @kouba01 for giving a well detailed lecture on Ichimoku Kinko Hyo Indicator Kumo Cloud, and i want to also welcome you back, thank God you are better now. So i will go strange to answering the assignment task.
1. Discuss Your Understanding of kumo as well as its lines.
Kumo is considered one of the most important feature in the Ichimoku Kinko Hyo chart and it is formed when the leading Span A and B crosses each other. The cloud enables users to identify the current and potential future trends, thats the support and resistance points so that when price appears to be above the kumo, it indicates a Bullish trend while when below, its indicates Bearish trend and lastly when price appears to be within the kumo space that is, its in the flat level, it indicates a trendless Scenario or Sideways Trend. Below shows the screenshots of what the kumo cloud looks like in the different scenario i mentioned above.
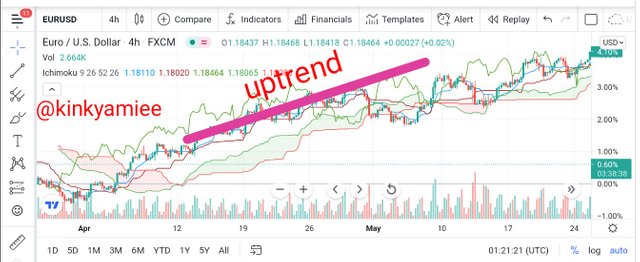
UpTrend: When the Span A is above Span B in the kumo, its in the bullish trend and moving upwards.
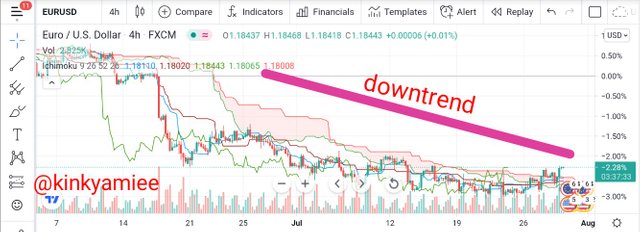
When the Span A is below Span B, its in the bearish trend and moving downwards
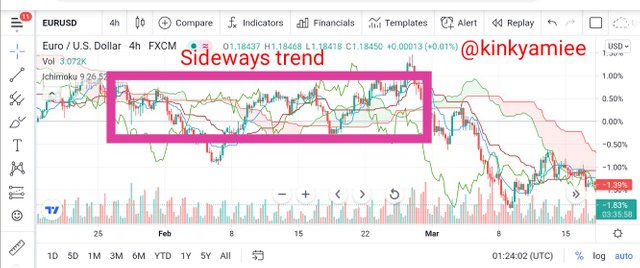
Here, there is no trend-like motion, the lines are just flat and does not create any kind of range.
Now that we have a better understanding of what the Kumo cloud is, we will be understanding the Lines too. The kumo cloud consist of two lines, the Senkuo Span A and B.
Senkou Span A
Senkou Span A is also known as the leading span A and it is one of the lines that forms the cloud called Kumo. It enables a user determine or measure the price momentum and also the trend of an asset that can help the user trade. The formula for calculating the Senkou Span A is gotten by adding the conversion line to the base line and dividing it by 2 with the plotted value being 26 periods in the future.
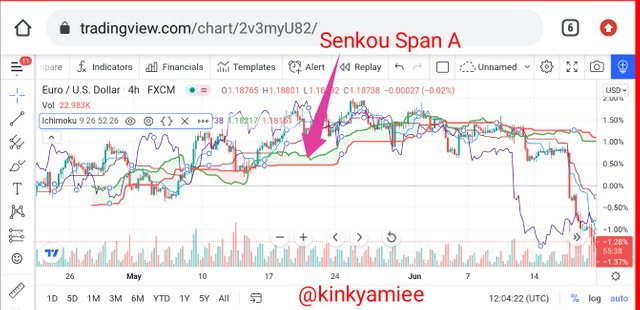
Senkou Span A
Senkou Span B
Senkou Span is also known as leading span B and its one of the important lines that forms the cloud called Kumo. It helps to determine the support and resistance level on the chart and provides an insight of where the next support and resistance level might be formed. It is known to be the slow line and when it crosses the Senkou Span A line, it is said to be a bearish trend. It is calculated by 52 Period High to 52 Period low and dividing by 2 which is plotted over 26 periods into the future.
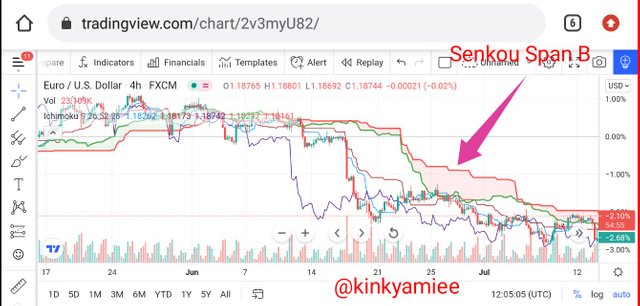
Senkou Span B
2. What is the relationship between this cloud and the price movement? And how do you determine resistance and support levels using kumo?
The kumo cloud is made up of two lines like i mentioned before, they are the leading Span A and B lines which creates a space between them. These lines determines the movement of price on the chart. Now, the relationship between the cloud and the price movement can be determined by the following:
- First, when the Span A line is above the Span B line, the price is said to be moving in an upwards trend which is the bullish trend.
- Secondly, When the Span B line is above the Span A line, the price is moving in a downwards trend and in to the bearish area.
- Lastly, the thickness or thinness of the kumo cloud. Now i shall explain further with some screenshot.
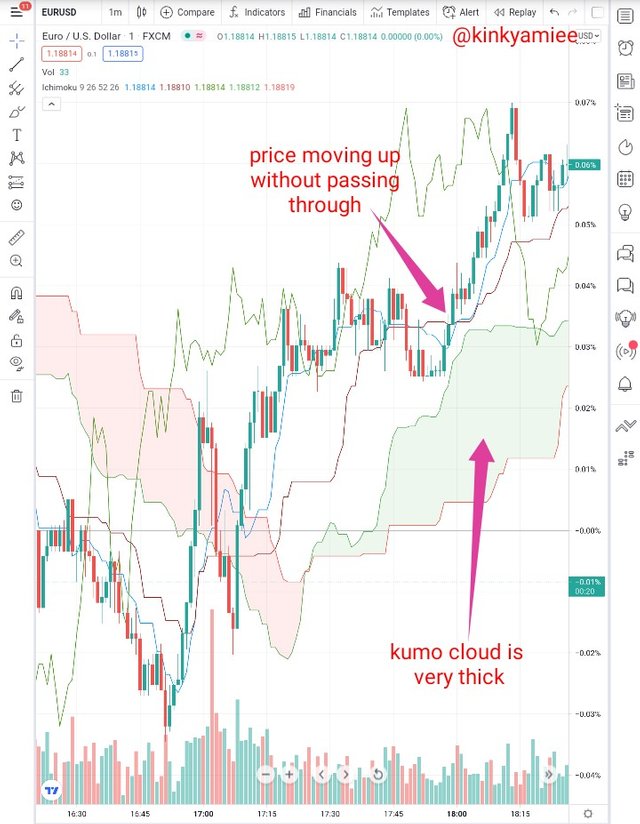
Thickness of the Kumo cloud.
So we know that the kumo is designed to determine the support and resistance levels but then when the cloud is thicker, the support and resistance it offers is stronger, the price tends to be volatile and there can be a trend reversal. So at this point, price can not penetrate through the cloud, be it upwards or downwards.
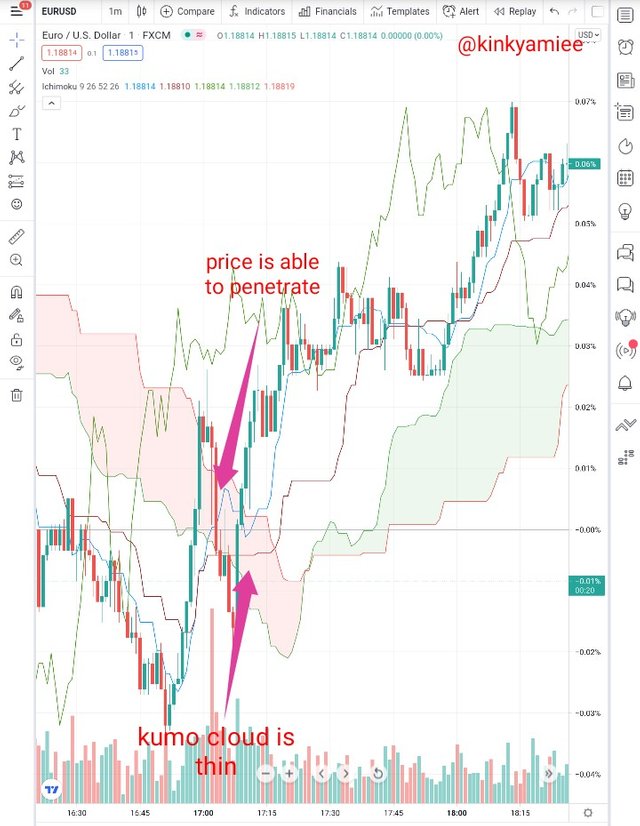
Thinness of the cloud:
This is just the opposite of when the cloud is thicker. Here, it is quite easy for price to penetrate or break-through the cloud be it upwards or downwards because its creates a weak support and resistance level. So when the cloud is thin, the market volatility is low.
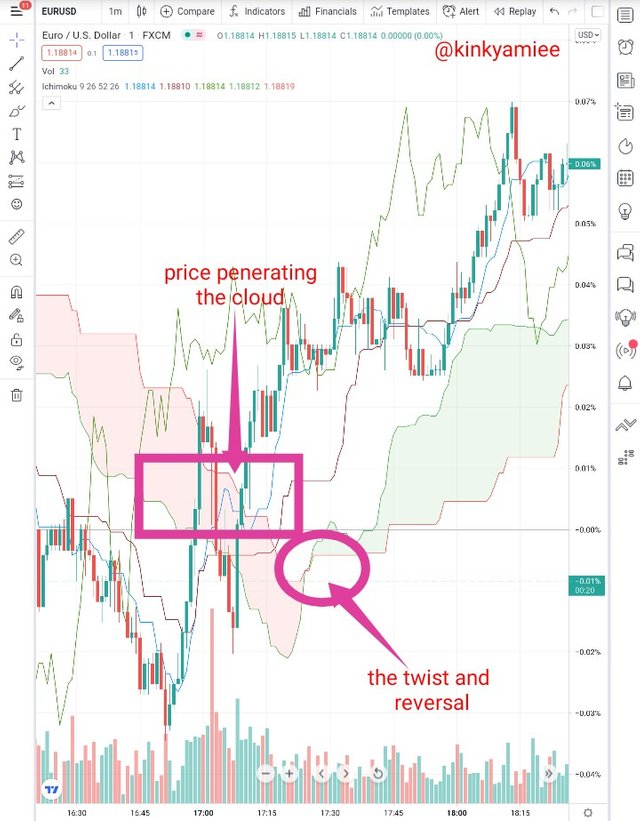
However, the thinness of the kumo cloud leads to a twist which indicates a trend reversal, with that, we can see that the market kept moving upwards showing a strong support and resistance just as we can see in the screenshot below.
Resistance and Supporting levels using Kumo Cloud.
I mentioned before thats the Senkou Span A and Senkou Span B lines form the Kumo Cloud and the shape they form shows how strong the resistance and support could be. Now this space that forms the cloud can either be flat or bulky and this determines where the price goes off for the support level or when it rejects the resistance level thats to say that the borders of the kumo cloud determines the support and resistance level.
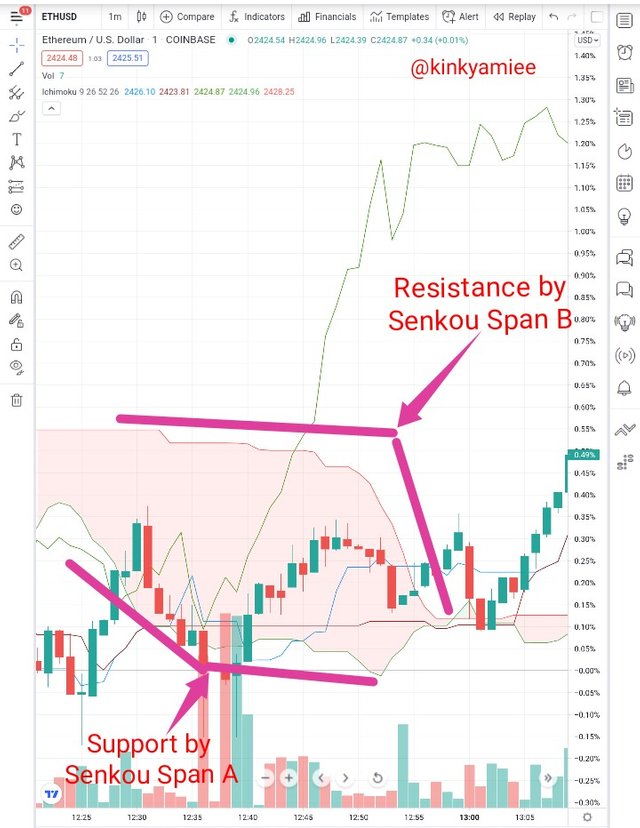
So from the screenshot above, we can see that Senkou Span A is working as a support while Span B is working as resistance so both of these lines are strong enough to make a price bounce back.
3. How and Why is the Twist formed?
The kumo twist is formed when Senkou Span A and Senkou Span B crosses each other, thereby changing it colors from either green to red or red to green whichever be the case. So when Senkou Span A crosses Senkou Span B, it is called a bullish Kumo twist and when Senkou Span B crosses Senkou Span A, its called a bearish Kumo twist.
However, Kumo Twist is formed because it shows an early signal that a potential trend can change in the future and it is very important that traders wait to understand the movement of the cloud so as to also understand the price trend before going into any form of trading.
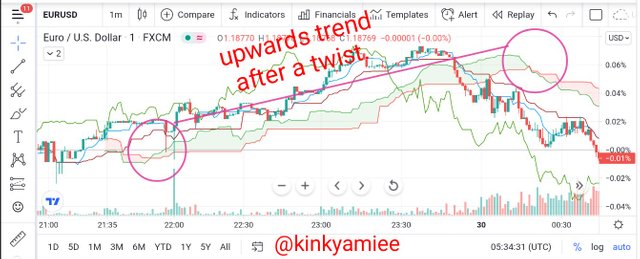
Uptrend after a twist
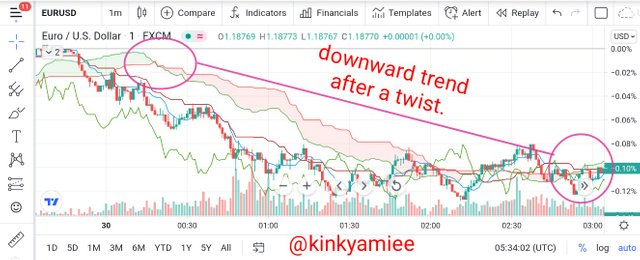
Downtrend after a twist
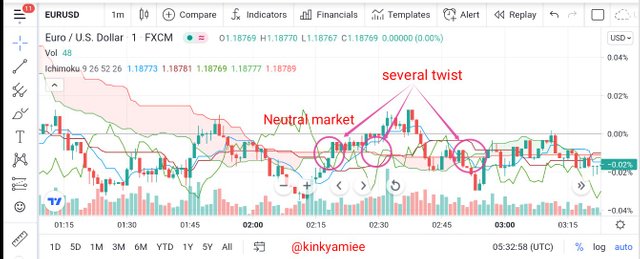
Neutral trend with several twist
How To Use the Twist In Trading.
Like i mentioned earlier, when the Senkou Span A crosses Span B, a Kumo Twist occurs and this is a trading strategy that a trader can use as an entry signal or a continuation signal. Now when cloud changes color from green to red from a twist that is, the kumo cloud has changed from being bullish to bearish, it is a signal that a trader should close his or her open BUY trade, just as seen in the screenshot below.
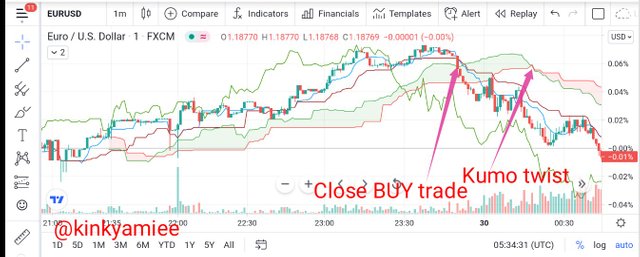
However, if the cloud changes from red to green, the Kumo twist can be used to open a new trade like we can see in the screenshot below,
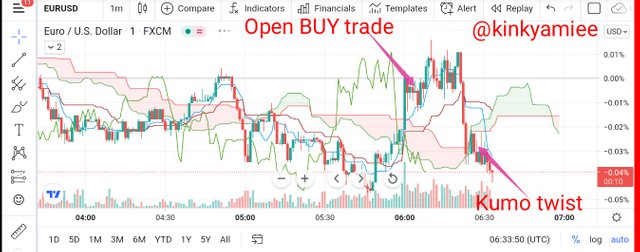
4. What is the ichimoku trend confirmation strategy with the cloud (kumo)?
Understanding a trend Confirmation involves understanding the three type of trend we have, which are the uptrends, downtrends and the neutral trend and this enables users understand that not all red space in the cloud is downtrend or all green space is an uptrend.
- Confirming Uptrends: To confirm an uptrend, the Senkou Span A is above B and the price has to enter the cloud from the bottom making the price remain above the cloud, this just tells the trader that the currency pair is in an uptrend.
-Confirming Downtrends: To confirm a downtrend, the Senkou Span A crosses Senkou Span B and be below it, the price then enters the cloud from the top and while the price remains below the cloud, the currency pair is in a downtrend.
-Confirming Neutral Trend: Here, Span A and B forms a flat pattern and the price movement is with in the cloud range.
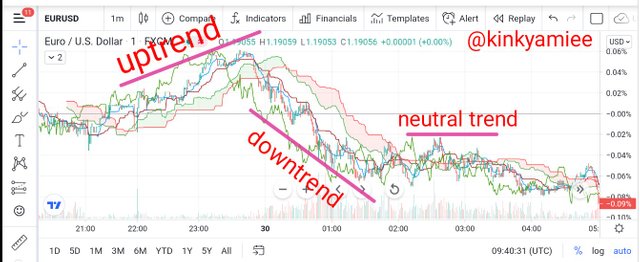
Trend Reversal.
The kumo cloud is known to hold price on one side of it, so that when price breaks it, it signals a reversal. Now there are some factors that will likely increase the chances of a reversal.
- first, The twist that is been formed after an uptrend is ended by the cloud.
- secondly, the Chikou Span is one of the factors that helps to spot a potential trend reversal. Here you can gain more insight on the strength of the price action, the bullish or bearish trend.
- thirdly, when the Senkou Span B is above the Senkou Span A which shows a signal of a downtrend.
- lastly, when the price is not able to penetrates the kumo cloud thats the thickness of the kumo and starts moving downwards.
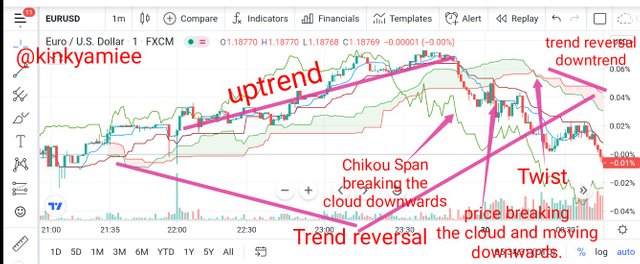
5. Explain the trading strategy using the cloud and the chikou span together.
The chikou Span is one of the most important lines in the Ichimoku indicator that is most times overlooked. Chikou Span is also referred to as Lagging Line because it only indicates the closing price which is 26 periods in the past. So it usually lags behind, but then it enable traders compare the current price action to the price action of 26 candles in the past. This gives the trader an insight of the trend direction and also to identify the strong support and resistance level. Now i am going to talk about trading strategy using the cloud and the chikou span line.
- When the current closing price is moving in the lower direction of the price action in the past which is the chikou Span, it indicates that the price is becoming weaker and showing signal of a bullish trend or price action for the future since price is known to follow a trend.
- Secondly, if the current price action is moving above the Chikou Span, it indicates that the price is becoming stronger and also showing signals of a bearish trend or price action for the future.
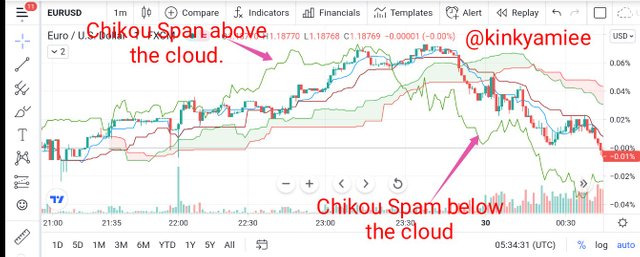
Moreso, because Chikou Span is plotted with the closing price of 26 period in the past, it can be used to indicate support and resistance.
6. Explain the use of the ichimoku indicator for the scalping trading strategy.
Scalping is a trading strategy that enables a trader make a fast profit within a small frame of time, that is, less than 1hr in the market and for the trader to avoid any kind of huge loss, it is important for the trader to have a strict exist strategy, hence this strategy can be used with the ichimoku indicator as it allows any time frame set by the trader.
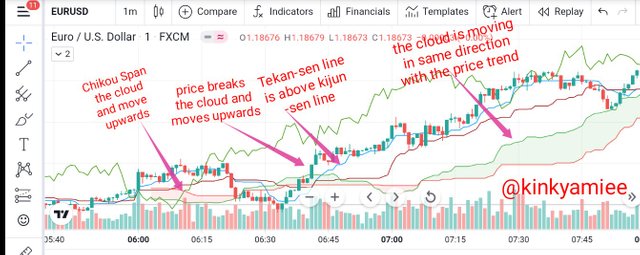
Uptrend Market
To confirm an uptrend using this method with the ichimoku indicator, the following needs to take place:
- The Tenkan-sen line has to be above the Kijun-sen line, which indicates a bullish trend.
- The Chikou Span should break the cloud and move in an upwards direction just as the cloud at that time.
- The price candle should break the cloud and move upwards as a resistance.
- And lastly, The Cloud should be moving upwards in same direction as the price trend.
Lets take a look at the screenshot below. The trader can open a small buy and sell trade and make a fast profit.
Downtrend Market.
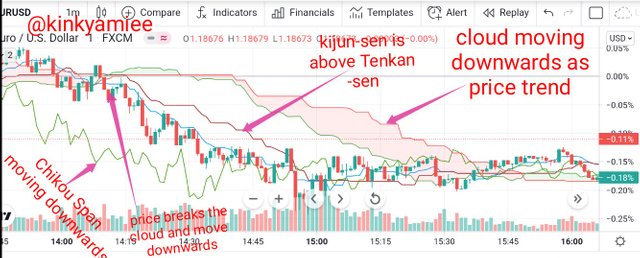
Just as we have seen the method at which we confirm an uptrend with the ichimoku indicator, we will also look at that of the downtrend.
- The Tenkan-Sen line has to be below the Kijun-Sen line indicating a bearish or downwards trend.
- The Chikou Span line should break the cloud and move in a downwards direction just as the cloud at the time.
- The price trend should break the cloud a support and move in a downwards direction.
- And lastly, The Cloud should be moving downwards in same direction as the price trend.
Lets take a look at the screenshot below. We can see that it contains all the factors for the use of this strategy with the indicator, so the trader can make a fast profit by doing a short sell and buy.
Conclusion.
The Kumo Cloud is a very important space in the ichimoku Indicator and it is made up of two lines, the leading Span A and leading Span B, they both have their calculations. They help in giving a trader a good insight on the support and resistance level and also indicate the trend reversal. The Kumo cloud has shown great relevance when used with the Chikou span and the Scalping trading strategy which have been helpful to trader that would want to make fast profits in a small time frame.
Thank you for reading.
Hello @kinkyamiee,
Thank you for participating in the 5th Week Crypto Course in its third season and for your efforts to complete the suggested tasks, you deserve a 9/10 rating, according to the following scale:
My review :
An article with excellent content in which you have provided a set of useful information to answer the questions posed, and I took some notes :
A good and deep explanation of the two lines of the Kumo cloud with a lack of interpretation of the cloud itself.
For the second question, your answers were excellent regarding the relationship of price movement momentum to the cloud as well as how to identify support and resistance levels.
True, this information is given to us in advance giving the trader time to act and consider taking his profits. The trader can also prepare to trade the probable range to come. By watching the twist, we will know faster than others that the trend is likely to run out of steam and we will be ready to trade the range before everyone else.
For your information the preferred strategy of Scalping with the Ichimoku indicator is called "Scalping Ichimoku in one minute M1", but we all know that the supports and resistances identified in the higher time frames will have a greater impact on the price trends. This is why the analysis of Ichimoku M15 and M5 is essential.
Thanks again for your effort, and we look forward to reading your next work.
Sincerely,@kouba01
Downvoting a post can decrease pending rewards and make it less visible. Common reasons:
Submit
Thank you very much prof. for your review.
Downvoting a post can decrease pending rewards and make it less visible. Common reasons:
Submit