Before I start I want to appreciate the team for such quality and awesome contest that would definitely keep one mind busy and sharp, i have really learnt a lot from creation of this article and I believe you would also learn something new 😉.
.png)
.png)
To be sincere with you I laughed 😂 when I saw the topic because I would never forget my first experience or encounter with this name Fibonacci, the first encounter was during my c++ exam. It was one of the exam questions, we were told to use C++ programming language to produce a Fibonacci sequence, the rest is story 😂😆.
Fibonacci retracements are is a type of technical analysis tool that physically looks like mere horizontal lines on the crypto chart used to easily analyze prices movement and trends, also this horizontal lines are used to identify or find support lines and resistance lines in the crypto market. The work in same sequence as the ancient Fibonacci sequence.
Fibonacci sequence is a mathematical theory founded by a great mathematician named "Sir Leonardo of Pisa" he was popularly known as Fibonacci, in the 13th century because of his discovery the Fibonacci sequence. The Fibonacci sequence or series usually starts with 0 and 1, and each next number would be the product from adding the last two numbers for example (0, 1, 1, 2, 3, 5, 8, 13, 21, 34, 55, 89, 144, 233, 377, 610, 987.etc). As we can see 21 is the result of adding 13 to 8 and 13 is the result from adding 8 to 5.
In most cases Fibonacci retracements technical analysis tool are generated from ratios that we were gotten from Fibonacci sequence theory which are usually 23.6%, 38.2%, 61.8%, 100% and in fewer cases 50%, as you can see 23.6 %+ 38.2% would give me 61.8 % and adding 38.2% to 61.8 % would give me 100%.
These levels are plotted on a price chart using horizontal lines to easily analyze and predict potential point for an asset's price to experience reversal or retracement because of it's awesome in acting as a support line and resistance line.
• 23.6%:
This is the lowest Fibonacci retracement level which mostly produces a mild pullback of price movement, this range is calculated using division of a numbers in the Fibonacci sequence by the number placed two places to its right. The 23.6% range Fibonacci retracement line is also called the shallow retracement level, because it's not as powerful, deep and efficient like the other Fibonacci retracement range lines.
• 38.2%:
This is second Fibonacci retracement line usually gotten by dividing a price value by the number placed one place towards the right hand side, the 38.2% Fibonacci retracement level is Known to signifies a deeper , better and more accurate retracement than the 23.6% ranged Fibonacci sequence. Just as I have said, it is known for producing or easily detecting support lines and resistance lines, depending on where it is located on the crypto market chart.
• 50%:
This is on important range of the Fibonacci retracement because it is not actually gotten from the Fibonacci sequence but was added because it was the half point of the Fibonacci retracement analysis tool. Because of it's positioning it's believe to also give effective and efficient support lines for the crypto market and a resistance line in the crypto market.
• 61.8%:
The 61.8% ranged Fibonacci retracement level is known as a "golden ratio" or "The golden mean," this level is gotten by easily dividing a price value a number two places to the left, instead of right as we have been seeing in other Fibonacci retracement range. It's called golden because it gives the golden opportunity or signal to crypto traders in the crypto market, it gives a deeper and most effective and efficient signal when compared to it i have mentioned above.
• 100%:
Unlike the other Fibonacci Retracement range, this 100% level don't gives traders retracement signal but shows a reversal to the initial or original value initial price level, in other words I will also say it's the biggest and strongest resistance or support line depending on how it was used.
• Analysis and discover Support and Resistance line:
Crypto and forex traders use Fibonacci retracements trading strategy to easily discover support lines and resistance line when trading and making analysis for price trends, price reversal and price retracement in a chosen period of time. This support lines and resistance lines are very important in the crypto analysis and this Fibonacci retracement theory help give users or traders a more accurate support lines or resistance lines to improve the productivity.
• Compactable with Other Technical Analysis Indicators or Tools:
For a better analysis and results traders usually join Fibonacci retracements with other technical indicators like KDJ, moving averages, or Bollinger bands indicator on the crypto market chart to confirm or predict price retracement or reversal at the same checking price Volatility and also the price trends before coming with a conclusion.
• Decision-making in Trading Strategies:
Fibonacci retracements assist traders in making profitable decisions about entry price and exit price for trades. For example, after a strong bearish movement in price of an asset, a trader can easily look for a buy opportunities with the help Fibonacci retracement, strategy to help that could easily point strategic point out reversal in price
• Risk Management:
Traders who use Fibonacci retracements can easily use it to manage risk by finding stop loss near the support line and a profitable take profit near a resistance line gotten from a well placed Fibonacci retracement strategy or tools.
.png)
.png)
Indeed this theory is very important and a very powerful strategy when analyzing reversal and retracement in the crypto market, most traders use the Fibonacci retracement strategy to produce productive, efficiently and effectively support line and resistance lines to easily monitor and analyze the path in which the crypto asset is moving over the period of time
All levels of the Fibonacci retracement strategy are very powerful and important but as I have said previously in this post that 61.8% range level is the most powerful and efficient in analyzing trade deeper than other range while using the Fibonacci retracement strategy .
The 61.8% Fibonacci retracement range/level is a very powerful resistance lines and could also be seen as a very powerful support lines, in most cases take their take profit before this line and their stop loss using this level.

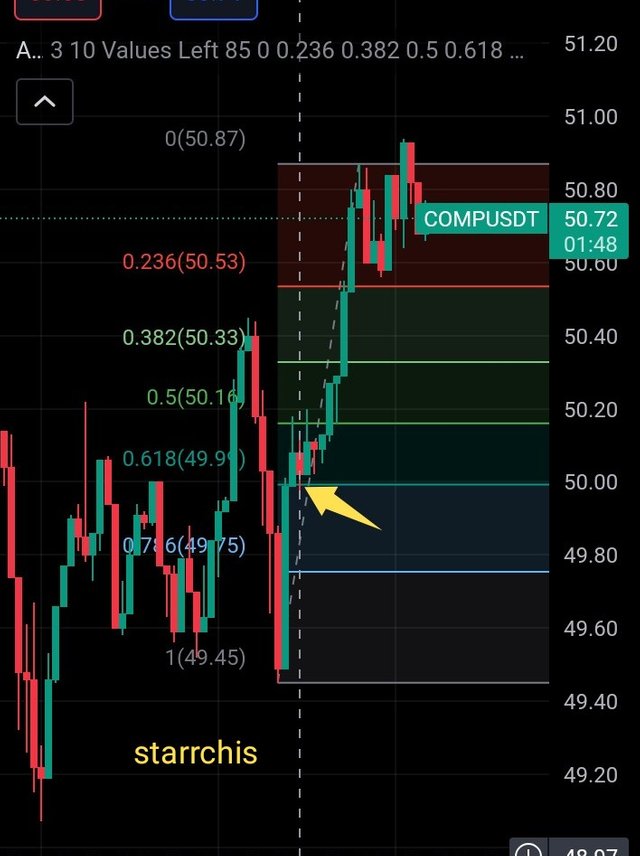
From trading view
After looking for a coin on a trending market. Using a COMP/USDT 15 min timescale chart we can see that the 61.8%/ 0.618 Fibonacci retracement strategy is on the price $50, the was an uptrend that started around 100% Fibonacci retracement strategy but there was a little downward and a retracement in the 61.8% Fibonacci retracement strategy which In turn lead to a profitable bullish signal

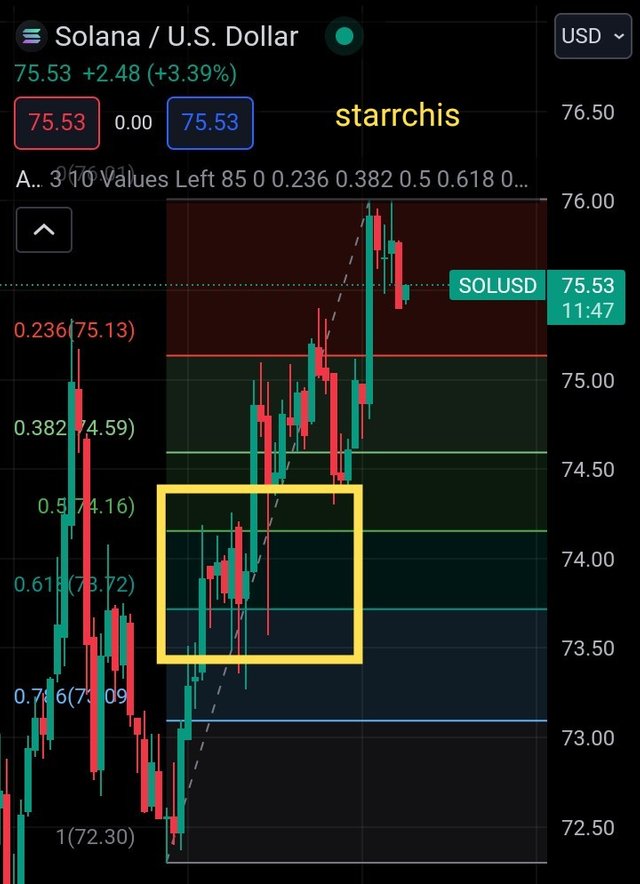
From Tradingview
Also a similar senerio was seen in SOL/USDT 15 min timescale chart we can see that the 61.8%/0.618 Fibonacci retracement strategy, that the was an uptrend that started around 100% Fibonacci retracement strategy but there was a downward and a retracement movement in the 61.8% Fibonacci retracement strategy which In turn lead to another profitable bullish run.
.png)
.png)
Just like other coins on the market, Fibonacci retracement strategy can also use to predict price movement on steem coin over a period of time, it is as effective and efficient especially in giving credible support lines, resistance lines, retracement spot and reversal spot on the crypto market. Below will be using Fibonacci retracement strategy to analyze the steem market.
Note: For safety purposes add one or two more analysing tools or analysing strategy to improve the percentage of accuracy in your prediction, I am using only Fibonacci retracement strategy here because it's our area of concentration. Please trade safely.

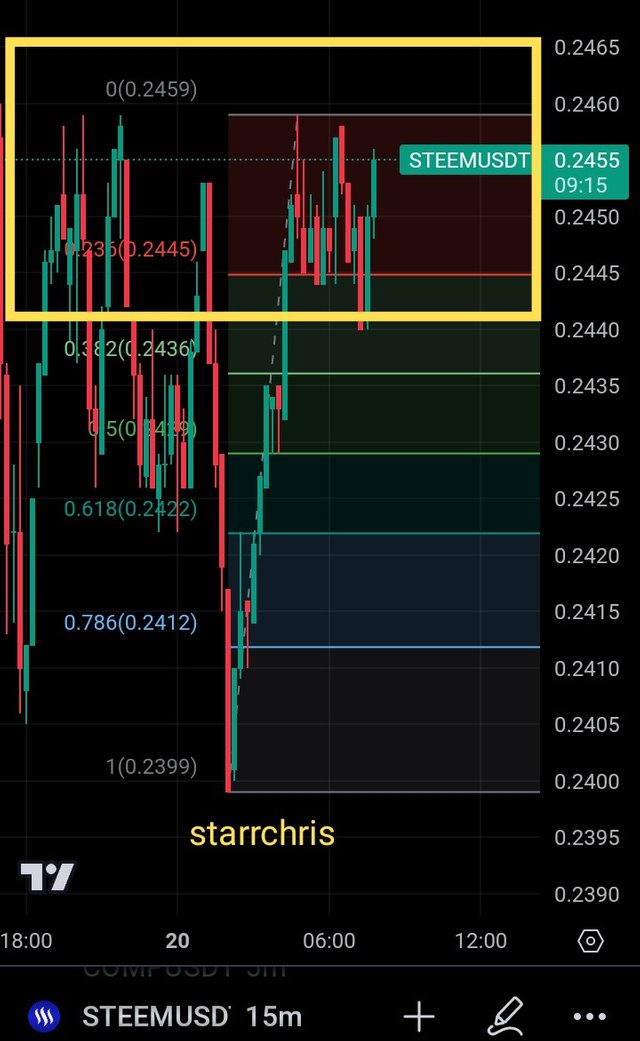
Using a STEEM/USDT 15 min timescale chart, we can see that the was a a downward movement and a retracement movement around the 23.6%/0.236 Fibonacci retracement strategy. There have been re-testing of the line 0 which now act as a resistance and the 23.6%/0.236 line which act as resistance, there is a retracement on the 23.6%/0.236 range which might break the 0 line to get a new high high or break downward and generate a bearing movement.
My advice is that we wait till it hits the resistance lines before making our next moves, the next move. If it passes the resistance lines then we buy but if it doesn't we sell to make profit in our trades.
.png)
.png)
Below 👇 i would be talking about mouth watering benefits of using this indicator and at the same i would be talking of so Disadvantages of the strategy, its no new thing to expect ot to have it's down side despite its powerful features.
✓ Producing Quality Support lines and resistance lines:
The Fibonacci retracement trading strategy is a very excellent 👌 tool to find quality support lines ans resistance lines while placing or analysing the crypto market, for those that don't know support lines and resistance lines are very essential in the analysis of a crypto market. Because it can generate you so many profit if you know how to use it well.
✓ Trusted By Many:
Fibonacci retracements strategy is trusted by so many traders in the crypto world, so therefore used by many crypto traders and forex traders globally. Their popularity has really influenced the market predictions, because most traders hope on it signals to add support lines and resistance line on the crypto market because if it efficiency and effectiveness in deriving signals.
✓ Take Profit And Stop Loss Signal:
Traders uses Fibonacci Retracements to easily identify potential stop-loss and take-profit for trades, the Fibonacci retracement levels help in marking take profit and setting stop-loss in crypto orders, as a medium to imploy Risk management to avoid loss.
✓ Easy To Understand With More Clarity:
The visual display if Fibonacci retracement on price charts is clearer and easier, Fibonacci retracement levels shows a clear visual signal that anyone can easily understand and monitor the strategy unlike some indicators that have so many lines that would easily confuse you while predicting. The clearity of the of the Fibonacci retracement strategy helps reduce errors in analyzing the trade.
✓ Compactable With Other Indicator:
Just like most indicators, Fibonacci retracement strategy can be added to other types of indicators to enhance the siginals gotten from the strategy, there are different indicators and strategy in crypto trading for different speciality. That's to say some indicators are best in monitoring the price of crypto asset while some are good in the checking of the market Volatility in a period of time.
🔻No Guarantee Signal :
Just like most indicators Fibonacci retracements there's no guarantee or any sort of assurance of accuracy in price prediction thats why i always advise that we should add other powerful indicators while analyzing. Note that adding of indicators should be done professionally, thats to say only two or three indicators should be added to avoid over crowding the crypto market chart ar same time.
🔻 Not really flexible:
Unlike indicators like Bollinger bands indicator that can be used to calculate Volatility and at the same time check an overbought and oversold in the crypto market, Fibonacci retracement can only handle support like retracement and reversal of a price movement in a period of time.
🔻 Effective Only On Trending Markets:
Unlike other indicators that can be used in all market types, the Fibonacci retracement strategy is most effective in only trending markets, so therefore they market can not be trusted in a stable market because they are not made for that sort of market structure. So therefore before using this indicator, you need to check the trend in the market over the period of time you intend to use the indicator
.png)
Fibonacci retracement strategy is very easy to learn, very easy to add to a chart and easy to analyze if you have sufficient knowledge of the Fibonacci retracement technical analysing strategy, thanks for going through remember to comment, vote and resteem if you are pleased.
I am inviting my friends @jasminemary @ngoenyi @hamzayousafzai @sahmie,Once again thanks 🙏 for going through, remember starrchris cares ❤️😍, Enjoy your life.
Saludos gran amigo starrchris, te felicito por tu buena calificación, demuestra el interés y las ganas que le colocaste a esta participación.
Una publicación bien estructurada, de principio a fin con una coherencia que nos va llevando por el tema, buena explicación sobre el origen de los retrocesos de finobacci y lo que significa los ratios.
Buenas imágenes de los gráficos y un buen análisis al aplicar la herramienta. Te deseo un feliz y bendecido día.
Downvoting a post can decrease pending rewards and make it less visible. Common reasons:
Submit
Gracias 🙏😁 dear friend I appreciate
Downvoting a post can decrease pending rewards and make it less visible. Common reasons:
Submit
Greetings brother,
The Fibonacci retracement strategy is actually a method used in analyzing charts. It's based on a sequence of numbers called the Fibonacci sequence. By applying this strategy, you can identify potential levels of support and resistance in the price movement of a stock or other assets. It's like using a ruler to measure and predict where the price might go next. Isnt it pretty cool? Of course, it's pretty cool once you get the hang of it. All the best in the contest.
Downvoting a post can decrease pending rewards and make it less visible. Common reasons:
Submit
I am blushing I must say it's an honor writing a post that pleases you
Downvoting a post can decrease pending rewards and make it less visible. Common reasons:
Submit
It's not just an honor, but a pleasure to have a friend like you who appreciates efforts. Your kind words mean a lot to me, and I'm really glad that I could bring you some joy.
Downvoting a post can decrease pending rewards and make it less visible. Common reasons:
Submit
Thank you, friend!


I'm @steem.history, who is steem witness.
Thank you for witnessvoting for me.
please click it!
(Go to https://steemit.com/~witnesses and type fbslo at the bottom of the page)
The weight is reduced because of the lack of Voting Power. If you vote for me as a witness, you can get my little vote.
Downvoting a post can decrease pending rewards and make it less visible. Common reasons:
Submit
Thanks friend 🙏
Downvoting a post can decrease pending rewards and make it less visible. Common reasons:
Submit
Absolutely! Combining Fibonacci retracements with other technical indicators like KDJ, moving averages, or Bollinger bands adds depth to the analysis. This multi-indicator approach not only helps in confirming potential retracements or reversals but also provides a more comprehensive understanding of price volatility and trends.
It's the synergy of these tools that contributes to a more informed and nuanced trading strategy. Well emphasized!
I have also participated in the contest, do well to check it out and engage. My post link to the contest.
Downvoting a post can decrease pending rewards and make it less visible. Common reasons:
Submit
Yea you are right friend thanks for commenting bro
Downvoting a post can decrease pending rewards and make it less visible. Common reasons:
Submit
Thank you for inviting me to read and learn from your post. I have participated already and I most confess that your entry is great. Success to you.
Downvoting a post can decrease pending rewards and make it less visible. Common reasons:
Submit
Awwn I am blushing already dear, thanks for commenting on my entry dear
Downvoting a post can decrease pending rewards and make it less visible. Common reasons:
Submit
Upvoted! Thank you for supporting witness @jswit.
Downvoting a post can decrease pending rewards and make it less visible. Common reasons:
Submit
Thanks big man
Downvoting a post can decrease pending rewards and make it less visible. Common reasons:
Submit
Greetings dear @starrchris! Your osm explanation of Fibonacci retracements is fantastic—your dedication to educating and analyzing crypto trends shines through!
Keep sharing these insightful posts; they're invaluable for the community's learning. Great work!
All the best in the contest—success for you! 👍
Downvoting a post can decrease pending rewards and make it less visible. Common reasons:
Submit
Thanks boss wishing success too
Downvoting a post can decrease pending rewards and make it less visible. Common reasons:
Submit
Your post has been successfully curated by @𝐢𝐫𝐚𝐰𝐚𝐧𝐝𝐞𝐝𝐲 at 40%.
Thanks for setting your post to 25% for @null.
We invite you to continue publishing quality content. In this way you could have the option of being selected in the weekly Top of our curation team.
Downvoting a post can decrease pending rewards and make it less visible. Common reasons:
Submit
Thanks boss
Downvoting a post can decrease pending rewards and make it less visible. Common reasons:
Submit
Has dado información educativa y valiosa sobre el origen de la secuencia de Fibonacci y tu experiencia con el lenguaje de programación C++.
Defines correctamente el concepto de los niveles de retroceso de Fibonacci como herramientas para identificar los puntos de soporte y resistencia del precio en el mercado.
Los niveles de Fibonacci identifican fácilmente los posibles límites de pérdidas y ganancias en las operaciones, también ayudan en la gestión de riesgos, lo que sugiere el planteamiento de una estrategia coherente.
Gracias por compartir.
¡Mucha buena suerte y éxitos!
Downvoting a post can decrease pending rewards and make it less visible. Common reasons:
Submit
😂😂😂, school gave me awesome memories indeed. Thanks for commenting
Downvoting a post can decrease pending rewards and make it less visible. Common reasons:
Submit
First of all background that you are explaining regarding this topic understanding is very interesting that it was your exam topic so whatever we remember in our exams we can never forget it so I agree with the definition that you have explain about this tool that is just like a mathematical sequence in the form of horizontal line we can see in any Crypto chart used for the analyzation of market trends either they are declineing or pumping
You have explained some of the levels in one of the most interesting way as well as you have shown us your technical analysis according to you which is acceptable and is it to understand for everyone success in this engagement challenge in which you put a lot of your efforts
Downvoting a post can decrease pending rewards and make it less visible. Common reasons:
Submit
I really appreciate your comment friend, exams leave permanent memories to our head. Once again thanks.
Downvoting a post can decrease pending rewards and make it less visible. Common reasons:
Submit
Fibonacci retracements can be used in a variety of ways, including identifying entry and exit points, determining stop loss and take profit levels, and analyzing the strength of a trend. In addition, they can also be used to predict potential reversals in the market. So, they can be a valuable tool for both technical and fundamental analysis.
Just like any other indicator, the FB retracements has it pros and cons
Overall, the main benefit of Fibonacci retracements is that they can provide traders with valuable information about the market. However, the main disadvantage is that they are not always accurate, and they should not be used as the only tool for making trading decisions. Additionally, some traders find them difficult to understand and use. So, while they can be a valuable tool, they should be used with caution.
Thanks for sharing and Goodluck with the challenge....
Downvoting a post can decrease pending rewards and make it less visible. Common reasons:
Submit
WOW you really took quality time for such quality comment friend I really appreciate your good work
Downvoting a post can decrease pending rewards and make it less visible. Common reasons:
Submit
Yes you are brother the Fibonacci Retracements are very useful to determine the entry and exit level of trading in crypto market. Indeed they are very useful tools for the technical analysis of crypto market but they have some pros and cons as well. As they are highly trusted by many trades so their too much use may affect the market negatively. By the way I'm very glad to read your publication. Keep shinning 🫂 and best of luck 🤞
Downvoting a post can decrease pending rewards and make it less visible. Common reasons:
Submit