Hey Steemit!
Here is my homework post for Professor @shemul21. It was a great lesson, and I hope you will enjoy reading my post.
.png)


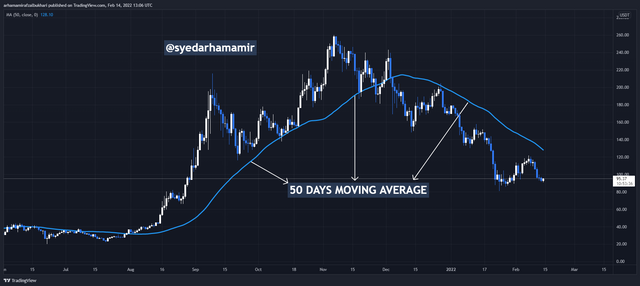
One of the most often utilised indicators among traders for analyse financial markets is the moving average. It's a technical indicator for chart technical analysis. Price might go upwards, downwards, or even sideways in the financial markets. To determine the direction of an item, a moving average indicator is used on the chart.
It's a price-following moving line just on main chart. Technical analysis is among the most popular methods for predicting price behaviour in financial trading, and moving average indicators, among others, play a critical role in predicting market price and direction.
Aside from determining an asset's trend, a moving average may also be used to detect an asset's support and resistance levels over time. Not only that, but it's also a popular way to spot reversal points. Traders often utilise the moving average indicator to place and exit trading orders.


2. What Are The Different Types of Moving Average? Differentiate Between Them.

- Simple Moving Average (SMA):
The easiest of all of the moving averages used on charts to identify the price movements of an asset is the Simple Moving Average. It determines an asset's average price. It displays market data for an item as a dynamic lines on the asset's main chart.
It acts with all of the prices on the chart, allowing investors and traders to determine an average Value of an asset over a certain time period. The simple moving average works in lockstep with the price, shifting its position when a candle forms.
Formula:
Simple moving average = sum of closing prices / number of days
OR
SMA= A1+ A2+ ....... + An / n
Where,
A1, A2, An = Prices on the given time period
n= time period
- Exponential Moving Average (EMA):
Another effective moving average that many traders utilise for technical analysis is the Exponential Moving Average (EMA). Exponential moving averages, like basic moving averages, follow an asset's trend direction. The main difference is that whereas moving average uses a basic formula to calculate the average price of an item in following direction, Exponential Moving Average uses a sophisticated computation to determine the most recent price changes in an asset.
To that end, the adoption of an exponential moving average improves the accuracy and efficacy of price movement forecast. In addition, because of its ability to forecast recent price changes and trend reversals, the exponential moving average is often utilised in short-term trading. Although many traders blend the exponential and basic moving averages to improve the outcome of their study.
Formula:
Multiplier = 2 / (1 + n)
where,
n= time period
Calculate the EMA = (Price today x Multiplier) + (EMA yesterday x ( 1 – multiplier)
- Weighted Moving Average (WMA):
The last form of moving average is the weighted moving average, which is likewise used to assess an asset's trend direction. It employs a statistical technique of calculation that favours the most recent price of an item. In contrast to a conventional moving average, a Weighted Moving Average takes into account less of the previous market price or data.
This sort of moving average heavily relies on the most current or most recent data.
Formula:
WMA = price1 x n + price 2 + ...... pricen / {n (n+1)}/2
Where,
n= time period
| SMA | EMA | WMA |
|---|---|---|
| It depicts the average value of the asset over time. | EMA takes into account the most recent value. | The emphasis is on decreasing recent data and using the most current data. |
| Its dependability is determined by the length of time or the value of time. | Its precision is based on a short time frame with a low value. | It's reliable both for long and short-term trading. |
| It is used in long-term trading. | It is appropriate for short-term trading. | It's utilised for both short-term and long-term trading. |

3. Identify Entry and Exit Points Using Moving Average. (Demonstrate with Screenshots)

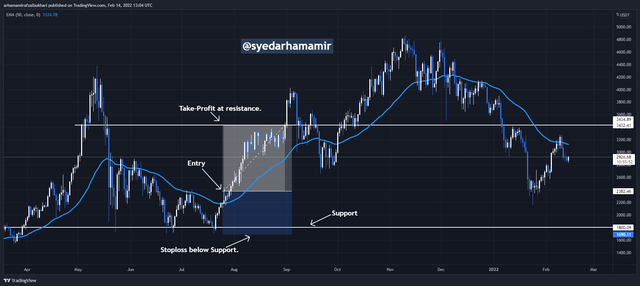
The chart below shows a buy trade. The Moving Average that I used is 100 Length. You can see the price crossing the 100 EMA towards the upside which indicates an uptrend. Therefore, at this point, I opened a long position. However, as we learned in the lesson, for the determination of the stop-loss and take-profit point I've used support and resistance lines. I've placed my take-profit at the resistance and my stop-loss below the support line.


Analysts often use crossover moving averages as a method. We can receive powerful signals by combining numerous moving averages plus moving average crossover, and this will assist us establish our entry and exit locations even more. Using just a Single Moving Average simply gives you the trend's direction, not a firm indicator of when it will finish. With a moving average crossover, we can get a solid sense of the trend and create entry and exit levels.
Either short - term and long- time periods are used in Moving Averages Crossover approach. When using the same kind of moving average with various time periods, such as with the Exponentail Moving Average, the shorter time period are more responsive to price movements than the longer time periods since the longer time period utilises more data points from the preceding time period.
We may monitor the chart when numerous moving averages are used seeing where they crossover. It is normally a bullish indicator when the quicker moving averages cross a slow one. We may purchase now, but it's usually a good idea to wait for a bullish candlestick to verify the signal before doing so. So when slower Moving Average Crosses the quicker one, on the other hand, it is a bearish indicator. If the trend is verified, we may enter a sell position.
Crossovers should only be used in moving markets, since they are more prone to provide misleading signals in consolidating or range markets.
We may utilise the market for signals when in a trend on something like a shorter timescale.


The following are some of these limitations:
By computing the average price, the moving average ignores numerous time series, allowing long-term trend series to be identified.
If you analyse using a non-effective moving average, you might easily be misled into trading with misleading signals, resulting in losses.
Because the moving average continually provides fresh data on an asset's average value, the predicted value has altered as well.
The fact that moving averages rely on more historical data raises the risk of erroneous signals, particularly if the asset's price changes significantly. Technically, the asset's price might change to something other than what it was before.


The moving average is indeed a popular technical tool in use by traders to perform technical analysis. It is beneficial for predicting market direction, identifying support and resistance levels, as well as determining market entry and exit points. Moving average also aids a trader in determining what the other traders do in the market based on price behaviour in accordance with the moving average at the given time.
Because moving averages monitor the price, detecting the trend is simple. However, the proper moving average must be employed at the right moment, otherwise you may end up with the wrong signals if you're using the wrong moving average. Moving averages, like other technical analysis tools, are not 100 percent correct, but when combined with additional indicators such as the stoichastic as well as SRI, the victory percentage is always high. Finally, I'd like to thank Professor @shemul21 for this amazing lesson.
@steemcurator02
Downvoting a post can decrease pending rewards and make it less visible. Common reasons:
Submit
@steemcurator02
Downvoting a post can decrease pending rewards and make it less visible. Common reasons:
Submit