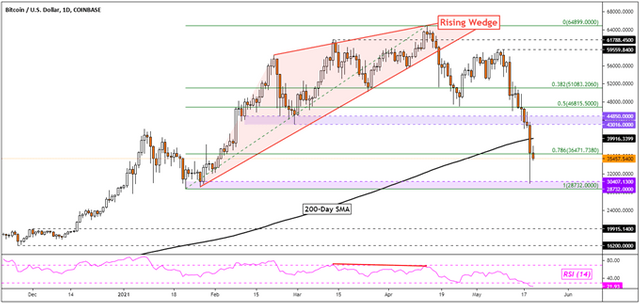
Bitcoin suffered its worst daily drop in over 14 months on Wednesday. Weakness wasn’t just isolated to BTC, but felt throughout digital currencies in one amplified move. This was a pronounced marketwide reaction that wiped out about US$1 trillion from the total crypto market cap. So where does this leave Bitcoin, Ethereum and Litecoin from a technical perspective? What could traders expect in the event of deeper losses?
BTC/USD completed the downside target implied from a bearish Rising Wedge chart pattern. This is something that I warned about in late April. However, prices swiftly bounced off the key 28732 – 30407 support zone as the cryptocurrency struggled to confirm a drop through the 30k handle. Dip buyers stepped in, trimming a decent chunk of losses.
Still, all eyes are now on the 200-day Simple Moving Average (SMA). It seems that Bitcoin has taken it out. A subsequent downside close after could paint a still-vulnerable road ahead for the cryptocurrency. Such an outcome would likely place the focus back on January lows. In the event of a turn higher, a push above the 43016 – 44850 inflection zone could open the door to more gains.