Hi everyone! You are welcome to the second week of cryptoacademy season 6 series. This week, professor @fredquantum took us on a topic titled "Crypto Trading Strategy with Triple Exponential Moving Average (TEMA) Indicator" at the end of which he gave an assignment. This is my response to the assignment he gave.
Question 1: WHAT IS YOUR UNDERSTANDING OF TRIPLE EXPONENTIAL MOVING AVERAGE (TEMA)?
The triple exponential moving average is a kind of exponential moving average (EMA) indicator which comprise of a single oscillating line. Unlike the normal exponential moving average, TEMA is calculated by combining 3 exponential moving averages, (thus the name Triple EMA). These three exponential moving averages are set at the same period.
The normal EMA has the lagging limitation with is common among moving averages. Patrick Mulloy came up with the TEMA indicator in a bid to reduce this lagging issue. Formally, the TEMA indicator was used only in stock market trading, but just like most indicators, it is now being applied in the cryptocurrency trading.
The reduction in lagging is achieved in the TEMA indicator because of its application of a function known as a smoothing function. This function is generated by calculation and what it does is to ensure that the indicator ignores random fluctuation of price.
Thus, when compared to the normal EMA, the data representation of price movement is more smoothened when TEMA indicator is applied. Also, TEMA is calculated using the price data changes that are of most recent, therefore it reacts to price movements faster.
All these implies that when identifying market trends, trend structures, resistance and support areas and lots more, it's best to use TEMA as the moving average indicator.
Just like other moving averages, the trend direction is represented by the TEMA indicator by a single slope oscillating line. Thus, when the market is moving in an upward trend, the oscillating line moves in an upwards trend. This oscillating line can be found just below the asset's price movement.
On the otherhand, when the market is moving in a downward trend, the oscillating line moves in an downwards trend also. This oscillating line can be found just above the asset's price movement.
QUESTION 2: HOW IS TEMA CALCULATED? ADD TEMA TO THE CRYPTO CHART AND EXPLAIN ITS SETTINGS. (Screenshots required).
The mathematical expressions for calculating the triple exponential moving average (TEMA) is given below:
TEMA = (3 × EMA1) - (3 × EMA2) + EMA3
Where;
EMA1 = represents the Exponential moving average
EMA2 = represents the EMA of EMA1
EMA3 = represents the EMA of EMA2
From this expression, we can see that the TEMA line is actually calculated from 3 EMAs which have the same period. The use of the same period further ensures the uniformity of the TEMA data obtained. Also, looking at the chart, we will notice that the EMA 1 and 2 are multiplied by 3. This ensures the smoothening of the values of the TEMA indicator within a specific period.
TEMA indicator can be added to a price chart by following the process below. For this example, I will be using the tradingview app.
Step 1:
Open the Tradingview's app and access the price chart you wish to consider.
On the price chart interface, click on the indicator icon located on the top side of the chart to add any indicator of your choice. This is shown in the screenshot below
Step 2:
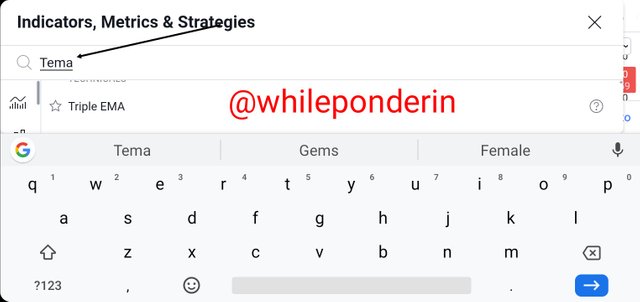
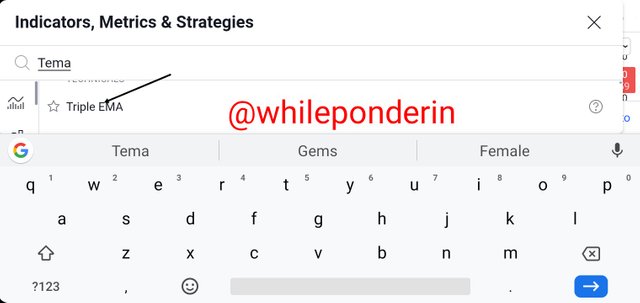
You will notice the search area. Under this, you can search for the Triple Exponential moving Average indicator with the aid of keyword such as Triple EMA or TEMA.
When you find it, select the indicator to add it to your price chart.
Step 3:
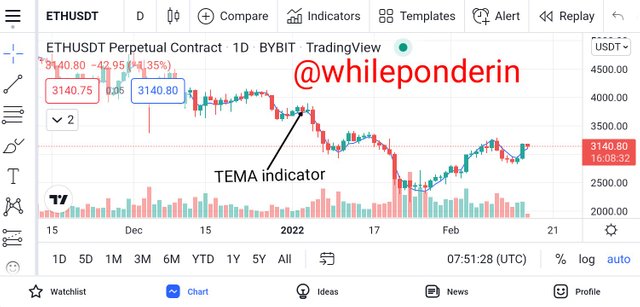
Go back to the chart you will notice that the TEMA indicator has been added to the chart.
Step 4:
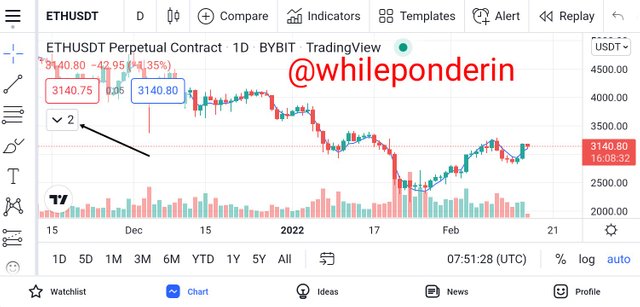
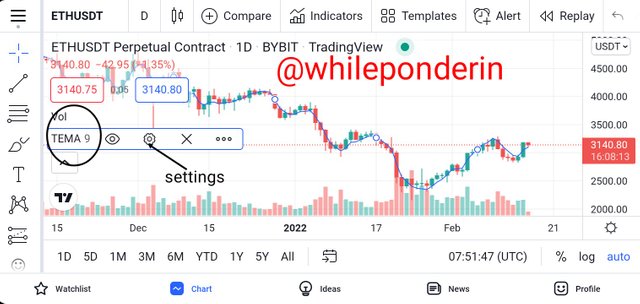
To change the settings of the TEMA indicator, on the left side of the chart you will notice a dropdown arrow. Click on it, then tap on TEMA.
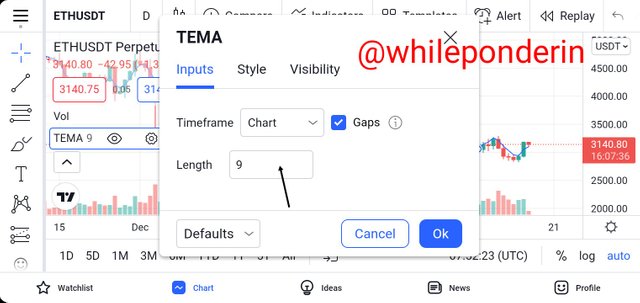
When you do, you will notice a settings icon, click on it to configure the indicator to your liking.
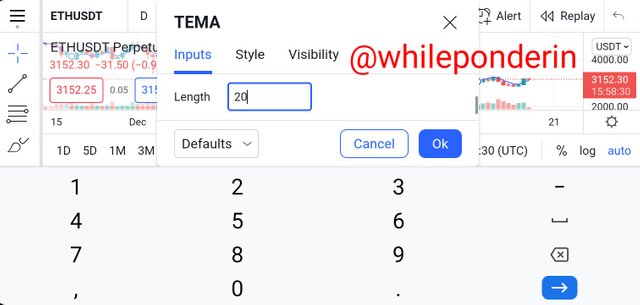
Based on default, the TEMA period length is normally set at 9. This 9 is best for scalp trades. But when it is set to periods such as 20, 21, and 25, it gives a more clearer signal.
Step 5:
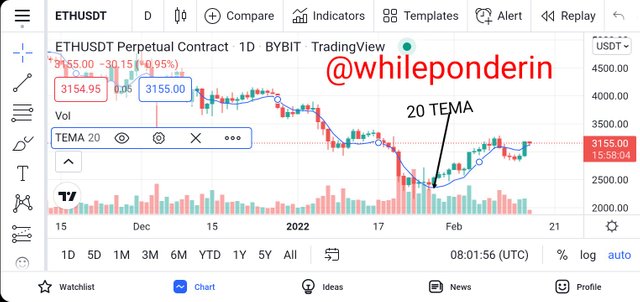
Finally, I chose 20. Below is how TEMA line after I chose the new period.
Question 3: COMPARE TEMA WITH OTHER MOVING AVERAGES. YOU CAN USE ONE OR TWO MOVING AVERAGES FOR IN-DEPTH COMPARISON WITH TEMA.
The main reason why Patrick Mulloy developed the TEMA indicator was to reduce the lag which is common among other types of moving averages. This reduction in lagging is what makes TEMA a more reliable trend indicator. TEMA is also more faster than other types of moving averages in revealing support and resistance levels as well as market reversals.
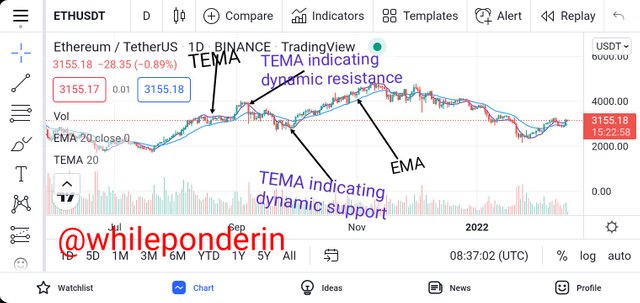
To better understand the difference between TEMA and other moving averages, let's compare the representation of the market by both TEMA and an EMA indicator. Both of them at set at the same period of 20 on a price chart.
On the chart above, we will notice that the TEMA (purple line) follows the movement of the price very closely. It indicated sharply changes in the movement of the price, resistance and support levels as well as trend reversals even faster than Exponential moving average EMA (Blue line). As expected, the EMA line lags behind the TEMA line, and we can see that the TEMA indicator is a better indicator between the two.
Also, since the TEMA line moves closely to the price line, it serves as a dynamic resistance to the price movement during an uptrend and as a dynamic support to the price movement during a downtrend.
Another type of moving average is the Simple moving average SMA. This type of moving average calculates the average price at a given interval. The fact that it considers the average price and tries to treat price data equally makes it lag even more than the EMA and the TEMA both which places more priority on recent price changes.
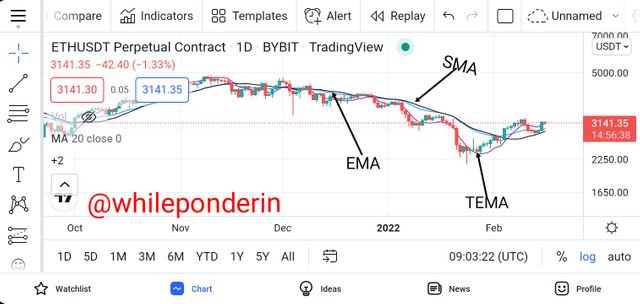
To better understand the difference between TEMA, EMA and SMA, let's compare the representation of the market by TEMA, EMA as well as the SMA indicator. The three indicators will be set at the same period of 20 on the price chart.
On the chart above, we will notice that the TEMA (purple line) follows the movement of the price very closely. It indicated sharply changes in the movement of the price, resistance and support levels as well as trend reversals even faster than Exponential moving average EMA (Blue line) and the SMA (black line). This makes it a better indicator amongst the three of them.
In addition, the EMA line is closer to the price movement and the TEMA line than the SMA. This means that although EMA is not better than TEMA, at least it has a lesser lag than the SMA line, and therefore, a better indicator between the two.
Also since it is closer to the price movement, TEMA serves as dynamic resistance in an uptrend movement while both the SMA and EMA serves as dynamic support since the price taps and rejects both SMA and EMA lines during pullbacks before it continues to move in it's original trend.
Likewise, in a downtrend movement, TEMA serves as dynamic support as it's closer to the price movement while both the SMA and EMA serves as dynamic resistance since the price taps and rejects both SMA and EMA lines during pullbacks before it continues to move in it's original trend.
In summary, we can say that TEMA is the best indicator amongst the three.
Question 4: EXPLAIN THE TREND IDENTIFICATION/CONFIRMATION IN BOTH BEARISH AND BULLISH TRENDS WITH TEMA (Use separate charts). EXPLAIN SUPPORT & RESISTANCE WITH TEMA (On separate charts). (Screenshots required).
Just like every other type of moving averages, the TEMA indicator is a trend-based indicator. This means that it can only be used on a trending market. Using the TEMA indicator, we can identify the trend of the market depending on the direction the indicator line is moving. This is because, the indicator line normally moves in the same direction as the direction of the price movement. Apart from revealing the current trend of the market, if can also point at places where there is probability of a price change. Thus it reveals to the trader points in the market with good trading opportunities.
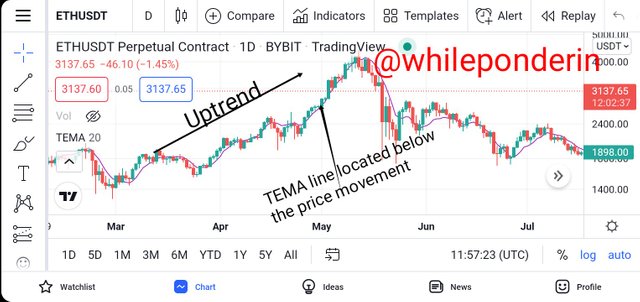
When using the TEMA to identify an uptrend, we will notice that the indicator line moves in the upwards direction same as the price movement. To further confirm if the trend is true, the TEMA indicator should be located just below the price movement. This is illustrated in the chart below:
From the chart, we can see that the trend of the TEMA indicator line correlates with the trend of the price movement (upwards). Also, we can confirm this by the fact that the TEMA indicator line is below the price movement.
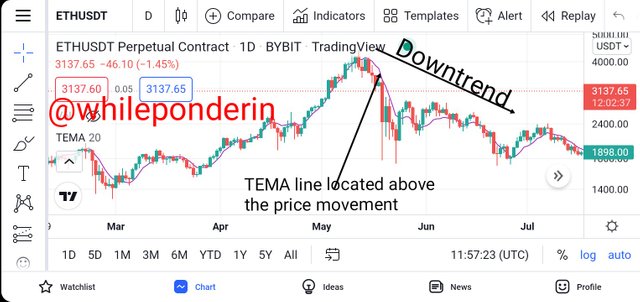
When using the TEMA to identify a downtrend, we will notice that the indicator line moves in the downwards direction same as the price movement. To further confirm if the trend is true, the TEMA indicator should be located just above the price movement. This is illustrate in the chart below:
From the chart, we can see that the trend of the TEMA indicator line correlates with the trend of the price movement (downwards). Also, we can confirm this by the fact that the TEMA indicator line is above the price movement.
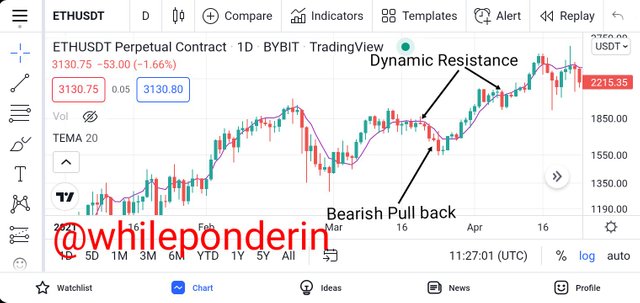
Unlike other moving average indicators, during an uptrend movement, the TEMA indicator serves as dynamic resistance to the movement of the price. Thus, whenever the price movement of the asset approaches the TEMA line, the price movement rejects the resistance. Whenever this occurs, it is an indication that there may be a trend reversal meaning that the uptrend movement is likely to change to a downtrend. A buy trade can be executed only after a pullback occurs and the price line rejects the TEMA indicator line. To illustrate this, let's consider the chart below:
From the chart above, we can see the TEMA line acting as a dynamic resistance to the price movement. When the price gets to the dynamic resistance, the price rejects the TEMA line and pulls back before it corrects and begins to move once again in the upward trend. Thus, using these resistance areas a trader can easily identify good exit points in a trade, and also, the end of the downward pullback can serve as a good place to execute a buy trade.
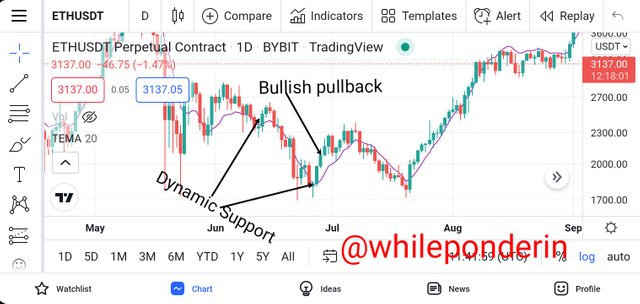
Unlike other moving average indicators, during a downtrend movement, the TEMA indicator serves as dynamic support to the movement of the price. Thus, whenever the price movement of the asset approaches the TEMA line, the price movement rejects the resistance. Whenever this occurs, it is an indication that there may be a possible trend reversal meaning that the downtrend movement is likely to change to an uptrend. A sell trade can be executed only after a pullback occurs and the price line rejects the TEMA indicator line. To illustrate this, let's consider the chart below:
From the chart above, we can see the TEMA line acting as a dynamic support to the price movement. When the price gets to the dynamic support, the price rejects the TEMA line and pulls back before it corrects and begins to move once again in the downward trend. Thus, using these support areas a trader can easily identify good exit points in a trade, and also, the end of the upward pullback can serve as a good place to execute a sell trade.
Question 5: EXPLAIN THE COMBINATION OF TWO TEMAs AT DIFFERENT PERIODS AND SEVERAL SIGNALS THAT CAN BE EXTRACTED FROM IT. Note: Use another period combination other than the one used in the lecture, explain your choice of the period. (Screenshots required).
One of the trading strategies applied by experienced traders is the combination of two TEMA lines in a chart. When using this trading strategy, we apply two TEMA indicators set at different periods on the chart. One of the TEMA should have a shorter period, while the other, a longer period setting.
When both are applied on a price chart, as expected, the TEMA indicator which is set at a shorter period will react faster to the movement of price than the TEMA indicator which has a longer period.
When these two TEMA indicators are applied on a chart, they reveal to the trader possible buying and selling opportunities available in the market. To illustrate this properly, I will be applying two TEMA indicators on a chart, with one of them set at a period of 20 while the other will be set at period 50.
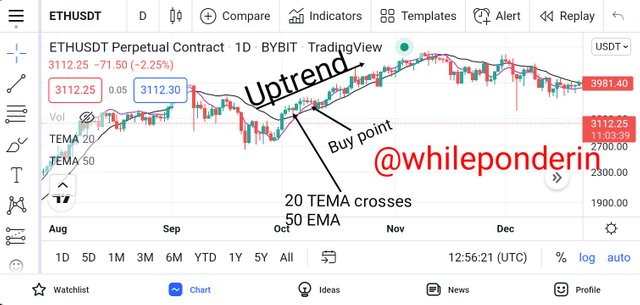
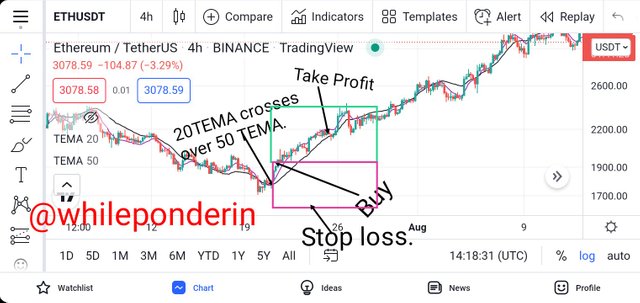
We will notice that whenever the 20 TEMA crosses above the 50 TEMA, it reveals that the market is bullish which implies that the buyers have a higher hand in the market. When this crossover occurs, we can perform a buy trade only after the price movement bounces off the TEMA at dynamic support. This is illustrated on the chart below.
From the above chart, we can see that when the 20 TEMA crossed above the 50 TEMA, the market began to move in the bullish trend indicating that the number of buyers is greater than the number of sellers. It also signals a good buy trading opportunity.
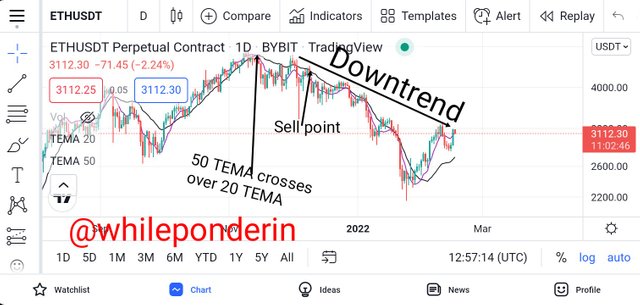
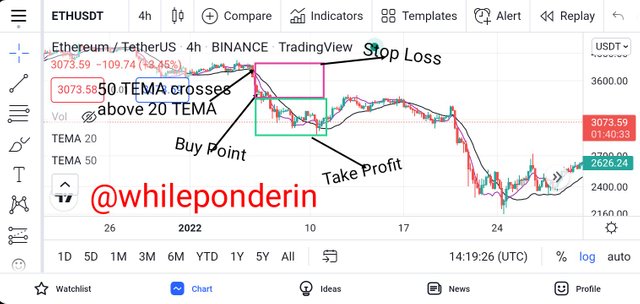
In the same way, we will notice that whenever the 50 TEMA crosses above the 20 TEMA, it reveals that the market is bearish which implies that the sellers have the upper hand in the market. When this crossover occurs, we can perform a sell trade only after the price movement bounces off the TEMA at dynamic resistance. This is illustrated on the chart below.
From the above chart, we can see that when the 50 TEMA crossed above the 20 TEMA, the market began to move in the bearish trend indicating that the number of sellers is greater than the number of buyers. It also signals a good sell trading opportunity.
QUESTION 6: WHAT ARE THE TRADE ENTRY AND EXIT CRITERIA USING TEMA? EXPLAIN WITH CHARTS. (Screenshots required).
When trading with the TEMA indicator, there are certain conditions that must be satisfied before a trade can be executed or exited. To demonstrate these criterias, I will be using the TEMA crossover strategy. I will also mention some of these conditions.
When carrying out a buy trade, the following criterias must be satisfied.
Add the two TEMAs to the price chart. These TEMA indicators should be set at different periods.
Since the market is moving on a downtrend, the TEMA should be located above the price movement.
Wait for the TEMA with the smaller period to cross over above the TEMA with a higher period. When this occurs, it signifies that the buyers are now in control of the price, thus a trend reversal has occurred.
After the crossover has occurred, wait for the price movement of the asset to break above the TEMA line. Wait for at least two candlesticks to be completed before executing a buy trade.
To exit the buy trade, wait for the price movement of the asset approach the dynamic resistance along the TEMA line. You can set your take profit and stop loss at the ratios of 1:2.
To further explain this, let's consider the chart below:
From the chart above, we can see that the trade began with a bearish move. Soon after, the TEMA with the smaller period crosses over above the TEMA with a higher period. Then, we waited for the price movement to break above the TEMA lines as confirmation that the market reversal has fully taken place. Then, we waited for two bullish candles to complete before executing a trade. Finally, we placed our stop loss just the previous low and then set our "take profit" at the resistance that is the most closest.
When carrying out a buy trade, the following criterias must be satisfied.
Add the two TEMA to the price chart. These TEMA indicators should be set at different periods.
Since the market is moving on a uptrend, the TEMA should be located below the price movement.
Wait for the TEMA with the higher period to cross over above the TEMA with a lower period. When this occurs, it signifies that the sellers are now in control of the price, thus a trend reversal has occurred.
After the crossover has occurred, wait for the price movement of the asset to break below the TEMA line. Wait for at least two candlesticks to be completed before executing a sell trade.
To exit the sell trade, wait for the price movement of the asset approach the dynamic support along the TEMA line. You can set your take profit and stop loss at the ratios of 1:2.
To further explain this, let's consider the chart below:
From the chart above, we can see that the trade began with a upward move. Soon after, the TEMA with the higher period crosses over above the TEMA with a lower period. Then, we waited for the price movement to break below the TEMA lines as confirmation that the market reversal has fully taken place. Then, we waited for two bearish candles to complete before executing a trade. Finally, we placed our stop loss just the previous highs and then set our "take profit" at the support that is the most closest.
QUESTION 7: USE AN INDICATOR OF CHOICE IN ADDITION WITH CROSSOVERS BETWEEN TWO TEMAs TO PLACE AT LEAST ONE DEMO TRADE AND A REAL MARGIN TRADE ON AN EXCHANGE (AS LITTLE AS $1 WOULD DO). IDEALLY, BUY AND SELL POSITIONS (Apply proper trade management). Use only 5 - 15 mins time frame. (Screenshots required).
To answer this question, I will be combining TEM indicator with RSI.
The RSI indicator is one of the most used indicators by experienced crypto traders. This indicator indicates whether a given market has been overbought, oversold, or whether the market is balanced.
When using the RSI, one has to pay attention to the RSI levels of 30 and 70. Whenever the price of an asset moves below the 30 RSI level, we say that the market has been oversold thus, there is a possibility that the market may reverse in the uptrend direction.
On the other hand, whenever the price of an asset moves above the 70 RSI level, we say that the market has been overbought thus, there is a possibility that the market may reverse in the downtrend direction.
It's very important that when combining the TEMA and RSI, we must make sure that all necessary conditions are met.
I will be performing two trades, one on Demo and my real account.
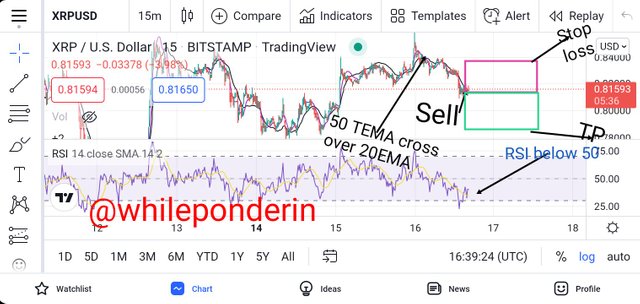
1. Demo Trade (SELL Trade) XRPUSD 15 MINS
From the chart above, we can see the that the 50 TEMA (black line) has crossed above the 20 TEMA (purple line). This indicates that the number of sellers is higher than the number of buyers in the market. This is further confirmed by the RSI as the RSI is still far below the 50 midpoint.
Based on these, I placed a sell trade order on my etoro demo account at $0.8050, setting my stop loss at $0.8400 and take Profit placed at $0.8180. The risk to reward on the trade was in a ratio of 1:1.7.
2. Buy Trade DASHUSD 15 MINS
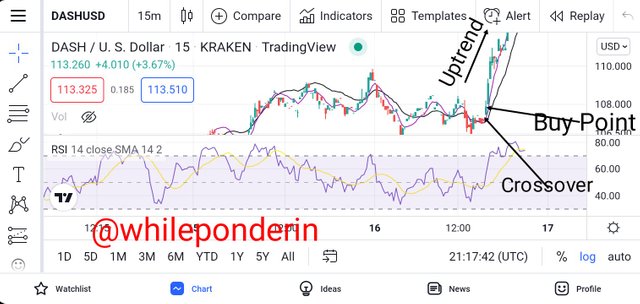
From the chart above, we can see the that the 20 TEMA (purple line) has crossed above the 50 TEMA (Black line). This indicates that the number of buyer is higher than the number of sellers in the market. This is further confirmed by the RSI as the RSI is above the 50 midpoint. Also, the second bullish candle has just been concluded.
Based on these, I placed a buy trade order on my account at $107.40, setting my stop loss at $106.40 and take Profit placed at $110.36. The risk to reward on the trade was in a ratio of 1:2
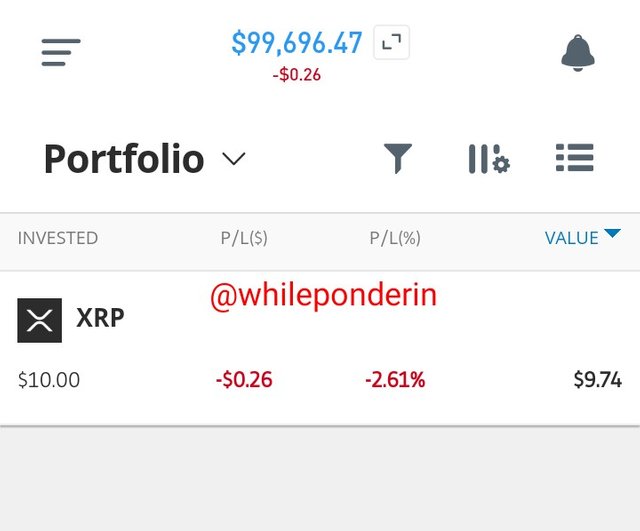
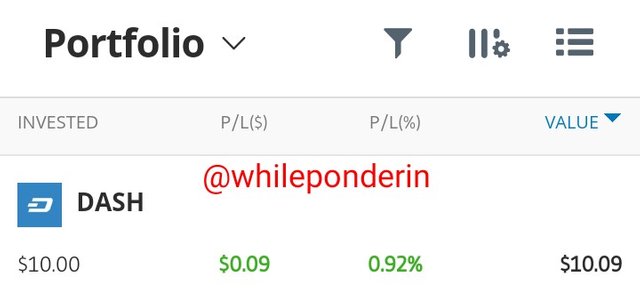
Below is the result of the trade. I made a profit of $0.09 on the trade.
QUESTION 8: WHAT ARE THE ADVANTAGES AND DISADVANTAGES OF TEMA?
The following are the advantages of the TEMA indicator:
Compared to other moving averages, the TEMA indicator adjust faster to the changes in price movement than EMA, SMA, e.t.c. This implies that lagging is greatly reduced in TEMA than in those other kinds of moving average. Thus, a trader can captilize on good trading opportunities early enough.
TEMA can be used to identify market trends. Based on the angle of it's indicator line, a trader can easily understand if the market is moving upwards or downwards.
With the aid of two TEMA indicators, a trader can apply the crossover strategy. Applying the crossover strategy can help a trader identify buying and selling opportunities.
A trader can use TEMA to identify dynamic resistance and supports levels with respect to the asset's price movement. This advantage enables traders to know which point exactly they can enter or exit a trade.
The following are the disadvantages of the TEMA indicator:
A trader can only use the TEMA indicator in trending market conditions. Once the market is not trending, the use of TEMA is greatly reduced. At best, it is gives only distorted trade signals.
Since the indicator reacts faster to price movement, when the market is volatile the probability that the indicator will generate an unclear signal is high making it unreliable on such conditions.
The triple exponential moving average is a kind of exponential moving average indicator which comprise a single oscillating line. Unlike the normal exponential moving average, TEMA is calculated by combining 3 exponential moving averages, (thus the name Triple EMA).
Compared to other moving averages, the TEMA indicator adjust faster to the changes in price movement than EMA, SMA, e.t.c. TEMA can be used to identify market trends, support, resistance levels etc. Although is an important tool in crypto trading, it also has some disadvantages such as, it's limitation in a trending market and the distorted signals it gives in a highly volatile market due to how fast it reacts to price changes.
PS: Would you like to visit some of the best bars in your area, check out my recipe checklist for that.
Thank you professor Morgan for this amazing lesson.


