Moving average is a tool for technical analysis on price charts that shows the average closing price of the market over a period of time that is set individually by the trader depending on the strategy that he chose to trade.
It's a widely used indicator by traders to determine the trend direction and momentum on the pairs which they will trade.
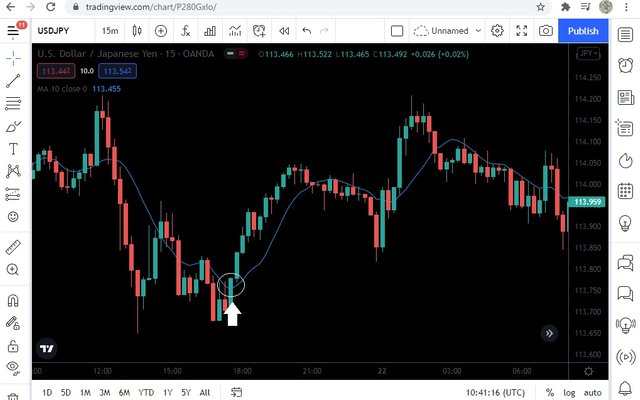
In case the candlesticks are above the Moving Average (MA) like in the pic below, that is considered an uptrend and you will take buy trades.

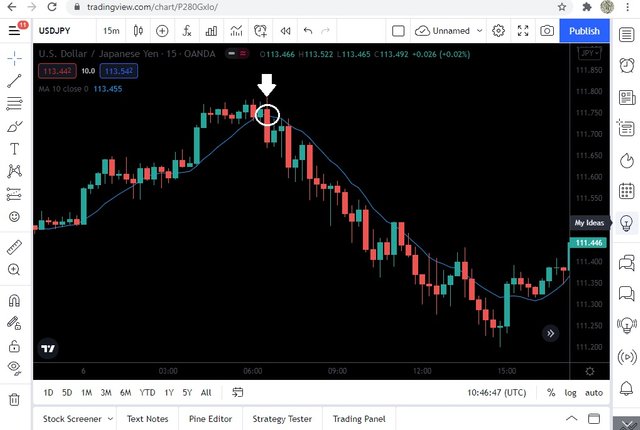
When we have set up like this as the picture below it's considered a downtrend because candlesticks are below the moving average and then we take sell trades.

All pictures are screenshots taken from tradingview
Disclaimer:
This post is not investment advice, it's only my personal understanding of the technical analysis of the market.
This post was resteemed by @steemvote and received a 4.46% Upvote. Send 0.5 SBD or STEEM to @steemvote
Downvoting a post can decrease pending rewards and make it less visible. Common reasons:
Submit
Downvoting a post can decrease pending rewards and make it less visible. Common reasons:
Submit
Upvoted! Thank you for supporting witness @jswit.

Downvoting a post can decrease pending rewards and make it less visible. Common reasons:
Submit
thanks for using steemegg.
Downvoting a post can decrease pending rewards and make it less visible. Common reasons:
Submit