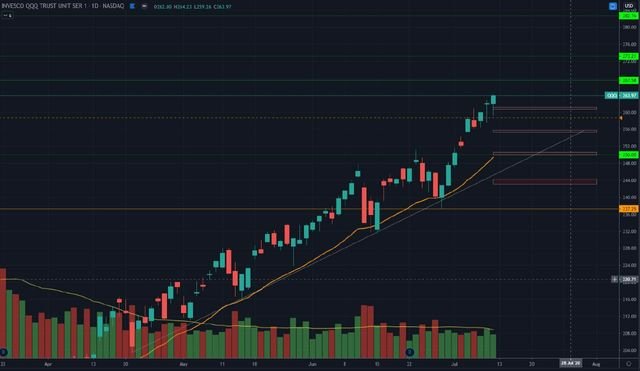
... and 273. Supports are 261, followed by 255. Any move below 255(last week’s low) would be a warning sign that more downside is possible.
The best way to manage positions at new highs is to watch the daily and weekly charts. The daily will be more real-time and show us more accurate critical levels. Also, look for divergence on daily RSI. So far, this is not shown and I am inclined to lean towards another green week.
Any break below the weekly low at 255 and price will likely head towards the 1D 21 EMA at 250. The 21 EMA on the 1D chart is a very important level as price tends to test the 21 EMA a lot in history. Look at Jun 29, Jun 12 and May 14. Price came down to test the orange 21 EMA each time.
