Hi everyone, as a graduate student in Physics I spent most of my time dealing with different data. In my undergraduate years, I worked in several experiments that require hours of gathering data, analyzing trends and patterns, and creating visuals that will allow others to have a grasp of what the data say. This set of skills has been my way of approaching problems in research and even in life. When a question comes around, the first thing I do is to find out relevant facts that allow me to understand the current situation. From what I understand, my next step is to communicate it [answer to the question] to other people. This is the same approach I do in Science, I find the necessary data, analyze, and present my findings.
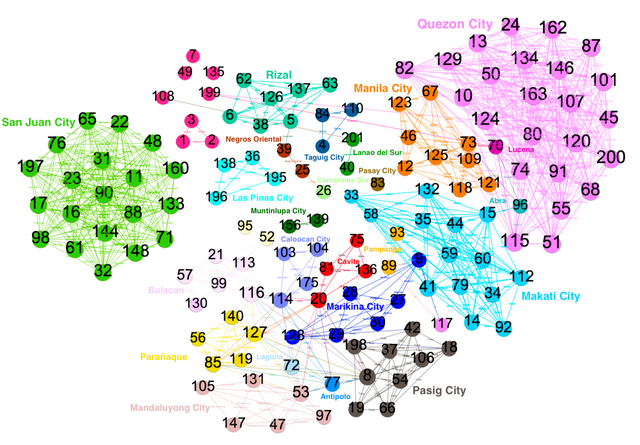
In the recent weeks, the rise of a pandemic alarmed everyone. As we all know, a new coronavirus has spread all over the world and in some countries a lockdown was imposed in order to contain the spread of the disease. Here in the Philippines, everything stopped, from schools to several industries. In the first two weeks of the lockdown implementation I was able to monitor the number of confirmed cases as the Department of Health(DOH) publishes data from tracing the contacts of the infected individuals.The figure below shows a network representation of the confirmed cases in the country. This network has 201 nodes or 201 individuals that tested positive for Covid-19. A connection was added between pairs of nodes if they reside in the same area, if they traveled from the same country, and if there was a direct contact between the individuals. I grouped the individuals according to the area they lived in which is shown through the different colors of the nodes. This data obtained on March 13, 2020 shows that local transmission of the disease has already spread. In the the community of the San Juan City residents, there is no connection established with any of the confirmed cases in the country. So the question is, how does the disease spread in that area if the given data does not show any of the transmission parameters I have set? In this case, the lack of data in tracing the contacts of the infected individuals constrains the visualization of how the disease spreads. As the days progressed, the number of confirmed cases has already reached 2,500+. This is not news since common models of disease transmission predict an exponential rise of the disease. The goal then is to implement measures that will flatten the curve in order to prevent fatalities. Because, the truth is we can only give proper care for a number of sick individuals. A nation's healthcare capabilities answer to the number of recoveries from the emergence of such disease.

In this short analysis, I saw how data don't lie, it gives an understanding to some extent. Given some models, data allow predictions and support logical actions that answer to the problem. To add up, the work of a scientist does not end with the technical analysis of a problem; it extends to how they are able to communicate their findings in such a way that it will be understood by many.