Hello there. About ten days ago I posted about the Steem price. I have added the daily and 4-hour charts I keep track of the steem price to my post. Today I noticed an occurrence on the monthly chart. I wanted to share the current version of my steem chart with you.

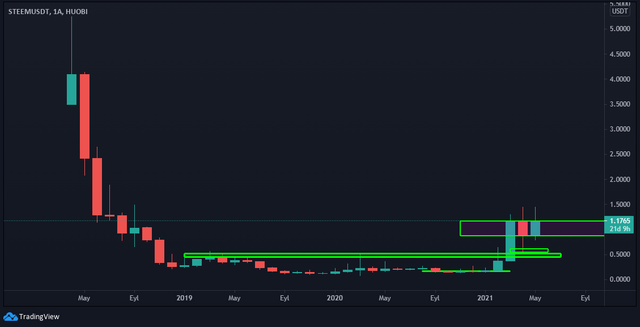
The image above is taken from the Steem / USDT monthly chart. As can be seen in the chart, a strong supply and demand zone is forming in the $ 0.85-1.16 region. It's about 22 days to candle closing. After this candle is closed, the newly opened candle should close above the level we mentioned so that our positive opinion on the price continues.

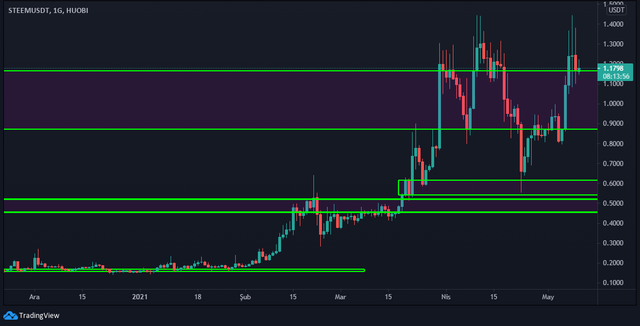
The chart above is daily. The drawing we see at the top is the supply-demand zone we talked about in the monthly chart. If the upward break occurs, there is no problem. However, if it breaks down, we need to follow the 0.61-0.53 supply-demand zone closely.
From a basic point of view, my expectation for Steem price is upward. Because our price is far behind compared to other crypto currencies. There is a lot of progress going on. It is a bit abnormal for the price to remain at these levels. Let's see what time will show.
I do not give investment advice. You should make your investment decisions yourself according to your financial situation and your psychological situation. It will be more beneficial for you to see my sharing as an educational work. See you in new posts.
Analiz bilgileri için teşekkürler hocam :)
Downvoting a post can decrease pending rewards and make it less visible. Common reasons:
Submit
Yorumunuz için ben teşekkür ederim.
Downvoting a post can decrease pending rewards and make it less visible. Common reasons:
Submit