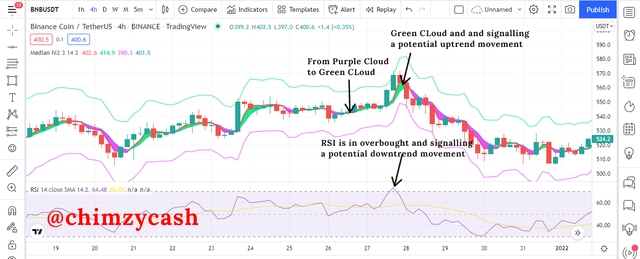
When using the median indicator for buy and sell signals, it is important to know that it is not perfect and that there is no technical indicator that is 100% perfect and accurate in its signals, that is why it is always advisable to combine the median indicator with another indicator like the RSI or MACD for signal confirmation and filtering false signals. For this demonstration, I will be combining the median indicator with the RSI indicator for filtering out false signals. The RSI indicator is a momentum indicator that indicates when the price is overbought or oversold. This makes it a great indicator to combine with the median indicator for signal confirmation and identifying false signals.
.png)
On the BNB/USDT chart, we can see that the median indicator signaled that the price is about to be bullish and a potential uptrend movement as the median indicator cloud changed from purple to green. We see a couple of green candles. The RSI indicator helped to identify the false signal as the RSI value is above 70 and in overbought zone which means that the market is about to reverse in a downtrend direction. After that, we can see that the price went into a downtrend.
Practical Demonstration of trade with the help of a median indicator
I will be making use of the median indicator in combination with the MACD for my buy and sell trades on the tradingview platform.
Buy Trade - AUDIO/USDT
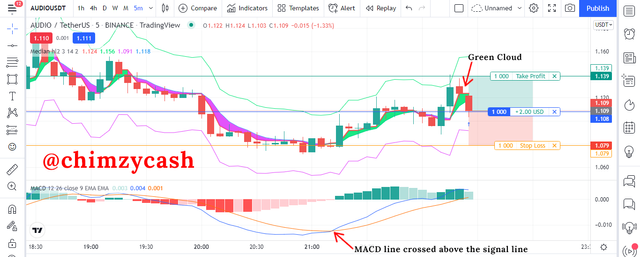
For the buy trade on the AUDIO/USDT on the 5 mins chart, the buy signal was identified after the median indicator formed a green cloud. On the MACD indicator, we can see that there is a bullish crossover as the MACD line crossed above the signal line making it a good buy signal. After the signal was identified, I placed a buy entry for AUDIO/USDT at 1.109 and using the 1:1 risk:reward ratio, I set my take profit at 1.139 and stoploss at 1.079.
Buy entry – 1.109
Take profit – 1.139
Stoploss – 1.079
.png)
After placing the buy entry, my buy position is still running as my stoploss hasn’t triggered as I expect to make profit from my buy trade.
.png)
Sell Trade - BNB/USDT
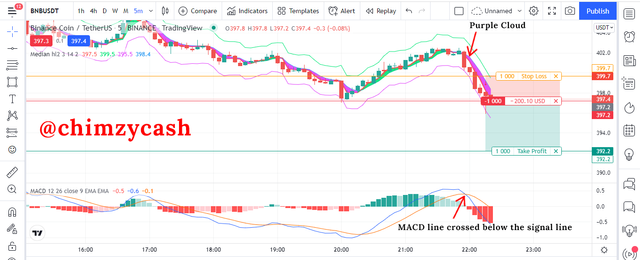
For the buy trade on the BNB/USDT on the 5 mins chart, the sell signal was identified after the median indicator formed a purple cloud. On the MACD indicator, we can see that there is a bearish crossover as the MACD line crossed below the signal line making it a good sell signal. After the signal was identified, I placed a sell entry for BNB/USDT at 397.2 and using the 1:2 risk:reward ratio, I set my take profit at 392.2 and stoploss at 399.7.
Buy entry – 397.2
Take profit – 392.2
Stoploss – 399.7
.png)
After placing the sell trade, I made a profit and closed my sell position on a profit.
.png)
The median indicator has shown that it is a very powerful and reliable trend-based indicator when it comes to identifying trend direction in the market and also giving out buy and sell signals for trading. However, the median indicator has proven to not be 100 percent accurate and perfect in its signals and as such, combining the median indicator with other technical indicators like RSI or MACD is a great way to filter out false signals on the chart and also for signal confirmation when it comes to trading any crypto asset.
