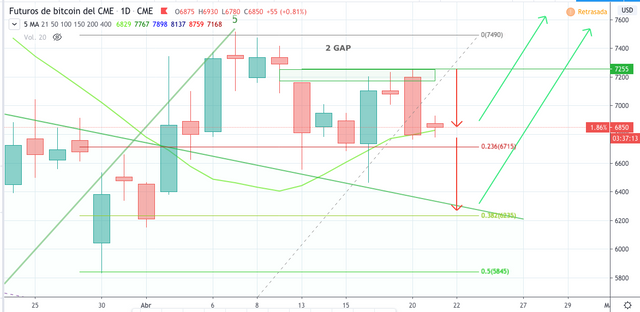
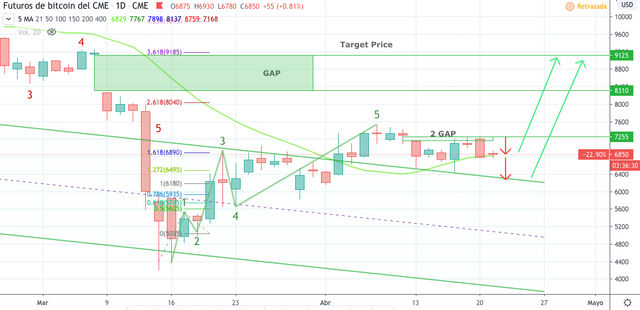
A few days ago, the price of Bitcoin has formed a new GAP in the CME. Yesterday you finished filling it.
Following the price of Bitcoin by the CME has made it easier for days to predict the possible upward or downward movements.
Let's see

Yesterday we see that this was the movement of the price of Bitcoin
Remember there is another GAP in the range of $ 8,300 to $ 9,100

Bitcoin's price has regressed and stopped at the 21-period MA 1-day midline.
Possibilities
Bitcoin price could pick up strength in 21-period median line to start new bullish cycle, to complete other GAP
The price of Bitcoin is in downward correction to break the 21-period median line could reach the upper limit of the bearish channel approximately $ 7,300. That would coincide with the 0.382 fibonacci retracement.
And what do you think?
Will the price of Bitcoin continue to drop or will it seek to complete the GAP of $ 8,300 to $ 9,100?
Leave your comment or vote.
Your opinion and participation is important
I need the collaboration with your comment and your vote so I can devote more time to the analysis. Making a post takes time I need your collaboration.
If someone requires an analysis of a crypto, leave in comments which one it would be and if it receives many votes we analyze it.
The idea I have now is to leave the graphs and together we analyze possible target.
Protect your assets use Stop loss
The alcoins market is very dependent on the price of Bitcoin, when Bitcoins goes up the alcoins go up more, but also in the other sense, so I suggest that you periodically review a Bitcoin and use stop loss and move it when they are already in profit. Do not let a profit become a loss.
Remember to give your post a vote, Thanks
I await your graphics or your comments.
We will continue monitoring
To be attentive
Protect your Investments
If the analysis helped you, give your vote with some steem, thanks !!
Lately I have noticed that there is no good analysis on steem, everything takes time, I ask that as you read them leave your vote, it is a way to encourage you to continue making more reports, thanks.
Feel free to use and share my post or graphics, but please mention, @criptoar as the author. Otherwise, consider plagiarism and I will call you and advise my friends to do the same.
READ DISCLAIMER: this publication / analysis is only for general information purposes. I am not a professional trader and I will never be a financial advisor. The material in this publication does not constitute any trading advice of any kind. This is the way I see the paintings and what my ideas are.
Perform your own analysis before making an investment decision. Use money that you are willing to lose if you make an investment.
If you make exchanges or investments after reading this publication, it is entirely at your own risk. I am not responsible for any of your gains or losses. By reading this publication, you acknowledge and agree that you will never hold me liable for any of your profits or losses.
Buy me a beer ! Donaciones Ligthing Network

The count of the green wave 5 in the last picture looks a little bit strange, but I don't know if you are using Elliott Wave here.
Downvoting a post can decrease pending rewards and make it less visible. Common reasons:
Submit
You are right the price movements in the CME, they form very particular elliot waves and differ from the exchanges.
Adapt the elliot waves to their particular shape and the analysis was done in 4 hours so that it shows well how the waves form
Thanks for the comment and for your vote.
Downvoting a post can decrease pending rewards and make it less visible. Common reasons:
Submit