I will be making my analysis on the btcusdt chart on what price may likely do soon as we continue to hope on the cryptocurrency market condition to change to a truly bullish phase.
We know for a fact that Bitcoin market is what truly drives the whole cryptocurrency market and that's not a suprise since it makes up up to halve of the total cryptocurrency market cap that's why it's the market mover of the cryptocurrency market so Bitcoin is hugely important to cryptocurrency moving.
So the price of Bitcoin is being majorly factored before deciding or making any prediction about any other cryptocurrency market as it's proven to be able to make or break the market.
My analysis on Bitcoin is majorly from the weekly timeframe then onto the daily timeframe as I will be checking out the path I believe price may likely follow soon.

Screenshot from trading view
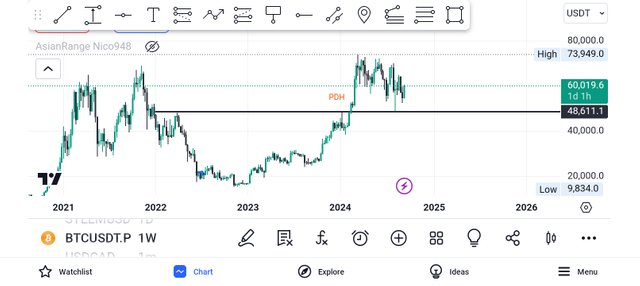
From the weekly timeframe we can see Bitcoin broke above a high recently, a former high almost an equal high on the weekly timeframe and as it broke the high on the weekly around $48,611 level and went onto a high on of $73,949 and since then price has taken a while to retest that previous high.
Now If we looking at the weekly we can see that just recently price seemed to have come down to retest the previous weekly high, infact we can see a considating price action on the weekly timeframe ever since price reached the $73k high it's being consolidating on the weekly trying to come down below to retest a previous high and from the chart it seemed to have done this.
We can see a long wick down by a weekly candle perfectly onto the previous high at $48,000 and then a sharp rejection of that level and since then price seems to have refused to go lower.
And we are seeing a bullish weekly candle forming after some weeks of bearish price action and chances are we close bullish which would signal a beginning of a bullish turnover in Bitcoin price which would no doubt be good for the whole cryptocurrency market, well let's see what the candlestick we close by.
The market closing bullish especially this present weekly candlestick that has less than 24 hours to close, after this observation on the weekly I moved on to the daily timeframe.

Screenshot from trading view
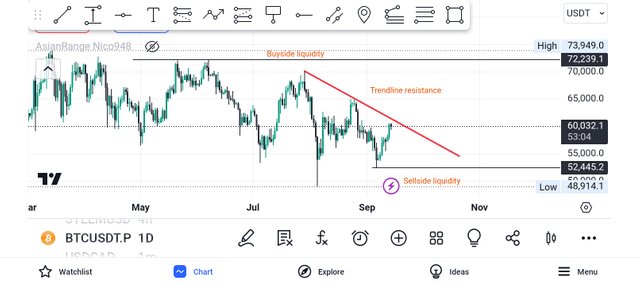
On the daily timeframe I observed what looks like trendline pattern and that is currently where Bitcoin is at the moment retesting that zone and ofcourse it remains to be seen if we are getting rejected or breaking out of this trendline resistance.
I mean the $60-61k level is really the level we ought to be watching out to know if we are going to be able to see some crazy gains in the market or are we going to witness a dump, well it remains to be seen.
From the chart though on the daily if we are to get rejected at this zone and price starts capitulating down what's the target and where are we looking at, well if we are rejected here it would signal a really bad bearish sign as price has failed to break above a major swing high on the daily whcih means it would be looking to take out a sellside or the target would then be the next low on the bearish which is around $52,445 and possibly even around $48,000 level.
This level is the price level we could get supported by in an event Bitcoin price gets rejected by the present resistance level is retesting though there is still a chance if we are rejected we won't reach that level but technically it would be the ideal next target in an event of a rejcetion around $60-61k.
Well that's the likely scenerio or the bearish scenerio, what if we break above that resistance level or that trendline resistance, well let's see.

If we manage to break above this resistance level and manage to have a daily candle close above then that's a good sign, if we see a daily candle close above and a next one form also above that trendline resistance then I would really know that we have turned bullish on the daily which would really show that the support on the weekly around the $48,000 tested on the weekly is holding.
And a break above $60-61k we see us targeting the high of that trendline pattern, and if we are seeing the high there we could also see that just close by we have a buyside liquidity a price level where there is equal high on the daily and ofcourse above oldhighs lies buyside liquidity and for such a break above I would expect price to take out that buyside which I believe would be our target for a break above.
That's the buyside liquidity around $73,949 that's our target for that case and if that were to happen then the market would really return to a good phase I believe.
So a rejection might see us reaching $52k if not $48k whilst a convincing break above would see us targeting higher price levels and possibly new all-time high, at the very least $74k would be within sight.
N/B:This is not intended as financial advice.
Upvoted! Thank you for supporting witness @jswit.
Downvoting a post can decrease pending rewards and make it less visible. Common reasons:
Submit
https://x.com/frank_anayo/status/1835196733665456470?t=eodzWrl_ULUN7FmgRfAB6A&s=19
Downvoting a post can decrease pending rewards and make it less visible. Common reasons:
Submit
Downvoting a post can decrease pending rewards and make it less visible. Common reasons:
Submit
Nice chart analysis. Hope BTC Will be increasing soon
Downvoting a post can decrease pending rewards and make it less visible. Common reasons:
Submit
Btcusd analysis is a great analysis. Thanks for sharing.
Downvoting a post can decrease pending rewards and make it less visible. Common reasons:
Submit