Red Tribe - The Klinger Oscillator (KO)
The KO is an oscillator which shows the money flow in and out of a cryptocurrency. It works through comparing volume and current price action.
The KO indicator consists of two lines, these are the KO line and a 13 day SMA. In the picture below we can see the KO indicator. The black line is the KO line, created through using data volume and current price action. The black line is simply a 13 day SMA.
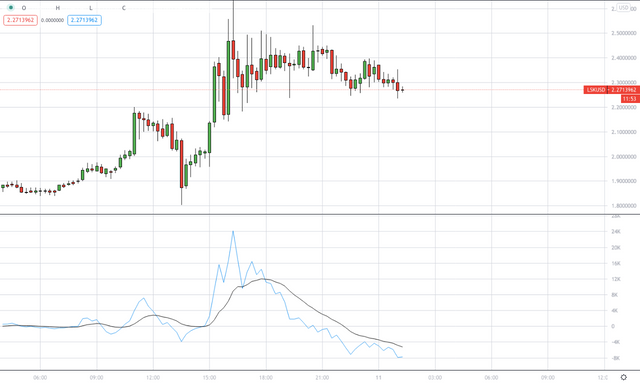
LSK/USD KO
Bearish crossovers
Crossovers produce both buy and sell signals. Firstly we will be looking at bearish crossovers. These occur when the KO line falls below the 13 day SMA. On the chart below we can see a bearish crossover indicated with the orange circle. LSK since the crossover occurred has lost 9% of its value.
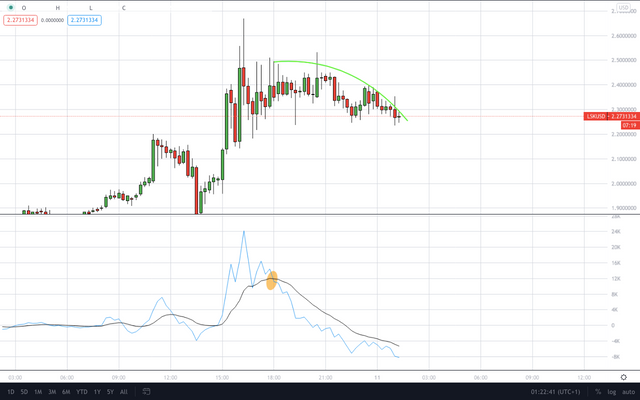
LKS/USD bearish crossover
Bullish crossovers
Bullish crossovers are the opposite to a bearish crossover and occur when the black SMA line falls below the blue KO line. In the example below we can see the bullish crossover which occurred, market with the orange circle.
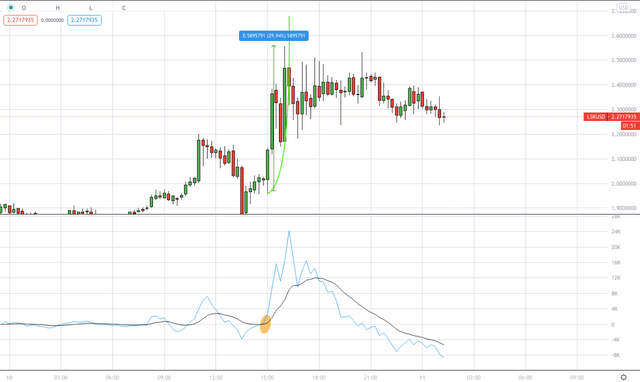
LSK/USD Bullish crossover
Support / resistance
During the trends identified by the KO the SMA can often act as support or resistance. Below we can see the SMA acting as resistance, preventing LSK from breakout out of its downwards trend. This has been identified in the chart below with the blue arrows.
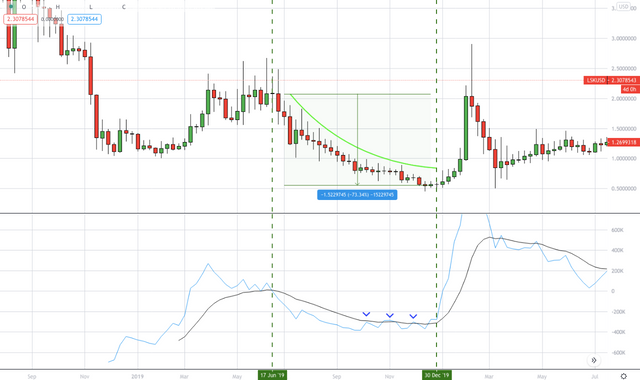
Divergences
Divergences occur when the KO indicator (including the 13 day SMA) moves in an overall different trend to the price of a cryptocurrency. This can then trigger a bullish or bearish signal.
Bearish divergences
Bearish divergences occur when the KO indicator moves up and the price moves down. Below we can see an example of a bearish divergence with BTC/USD.
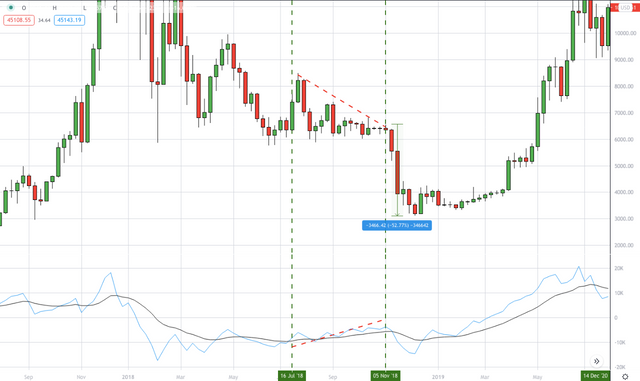
BTC/USD bearish divergence
Bullish KO divergence
A bullish divergence divergence occurs when the indicator is moving in a downwards trend and the price in an upwards trend. There is an example below using FLM/USD.
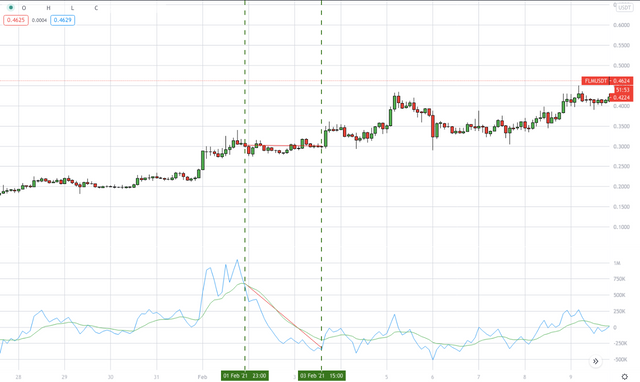
Conclusion
In conclusion the KO indicator is useful for identifying trends, however the most useful part of the technical indicator is the divergences.
For more free indicators / articles / TA check out our website - redtribe.xyz
Join our free Telegram channel - https://t.me/red_tribe