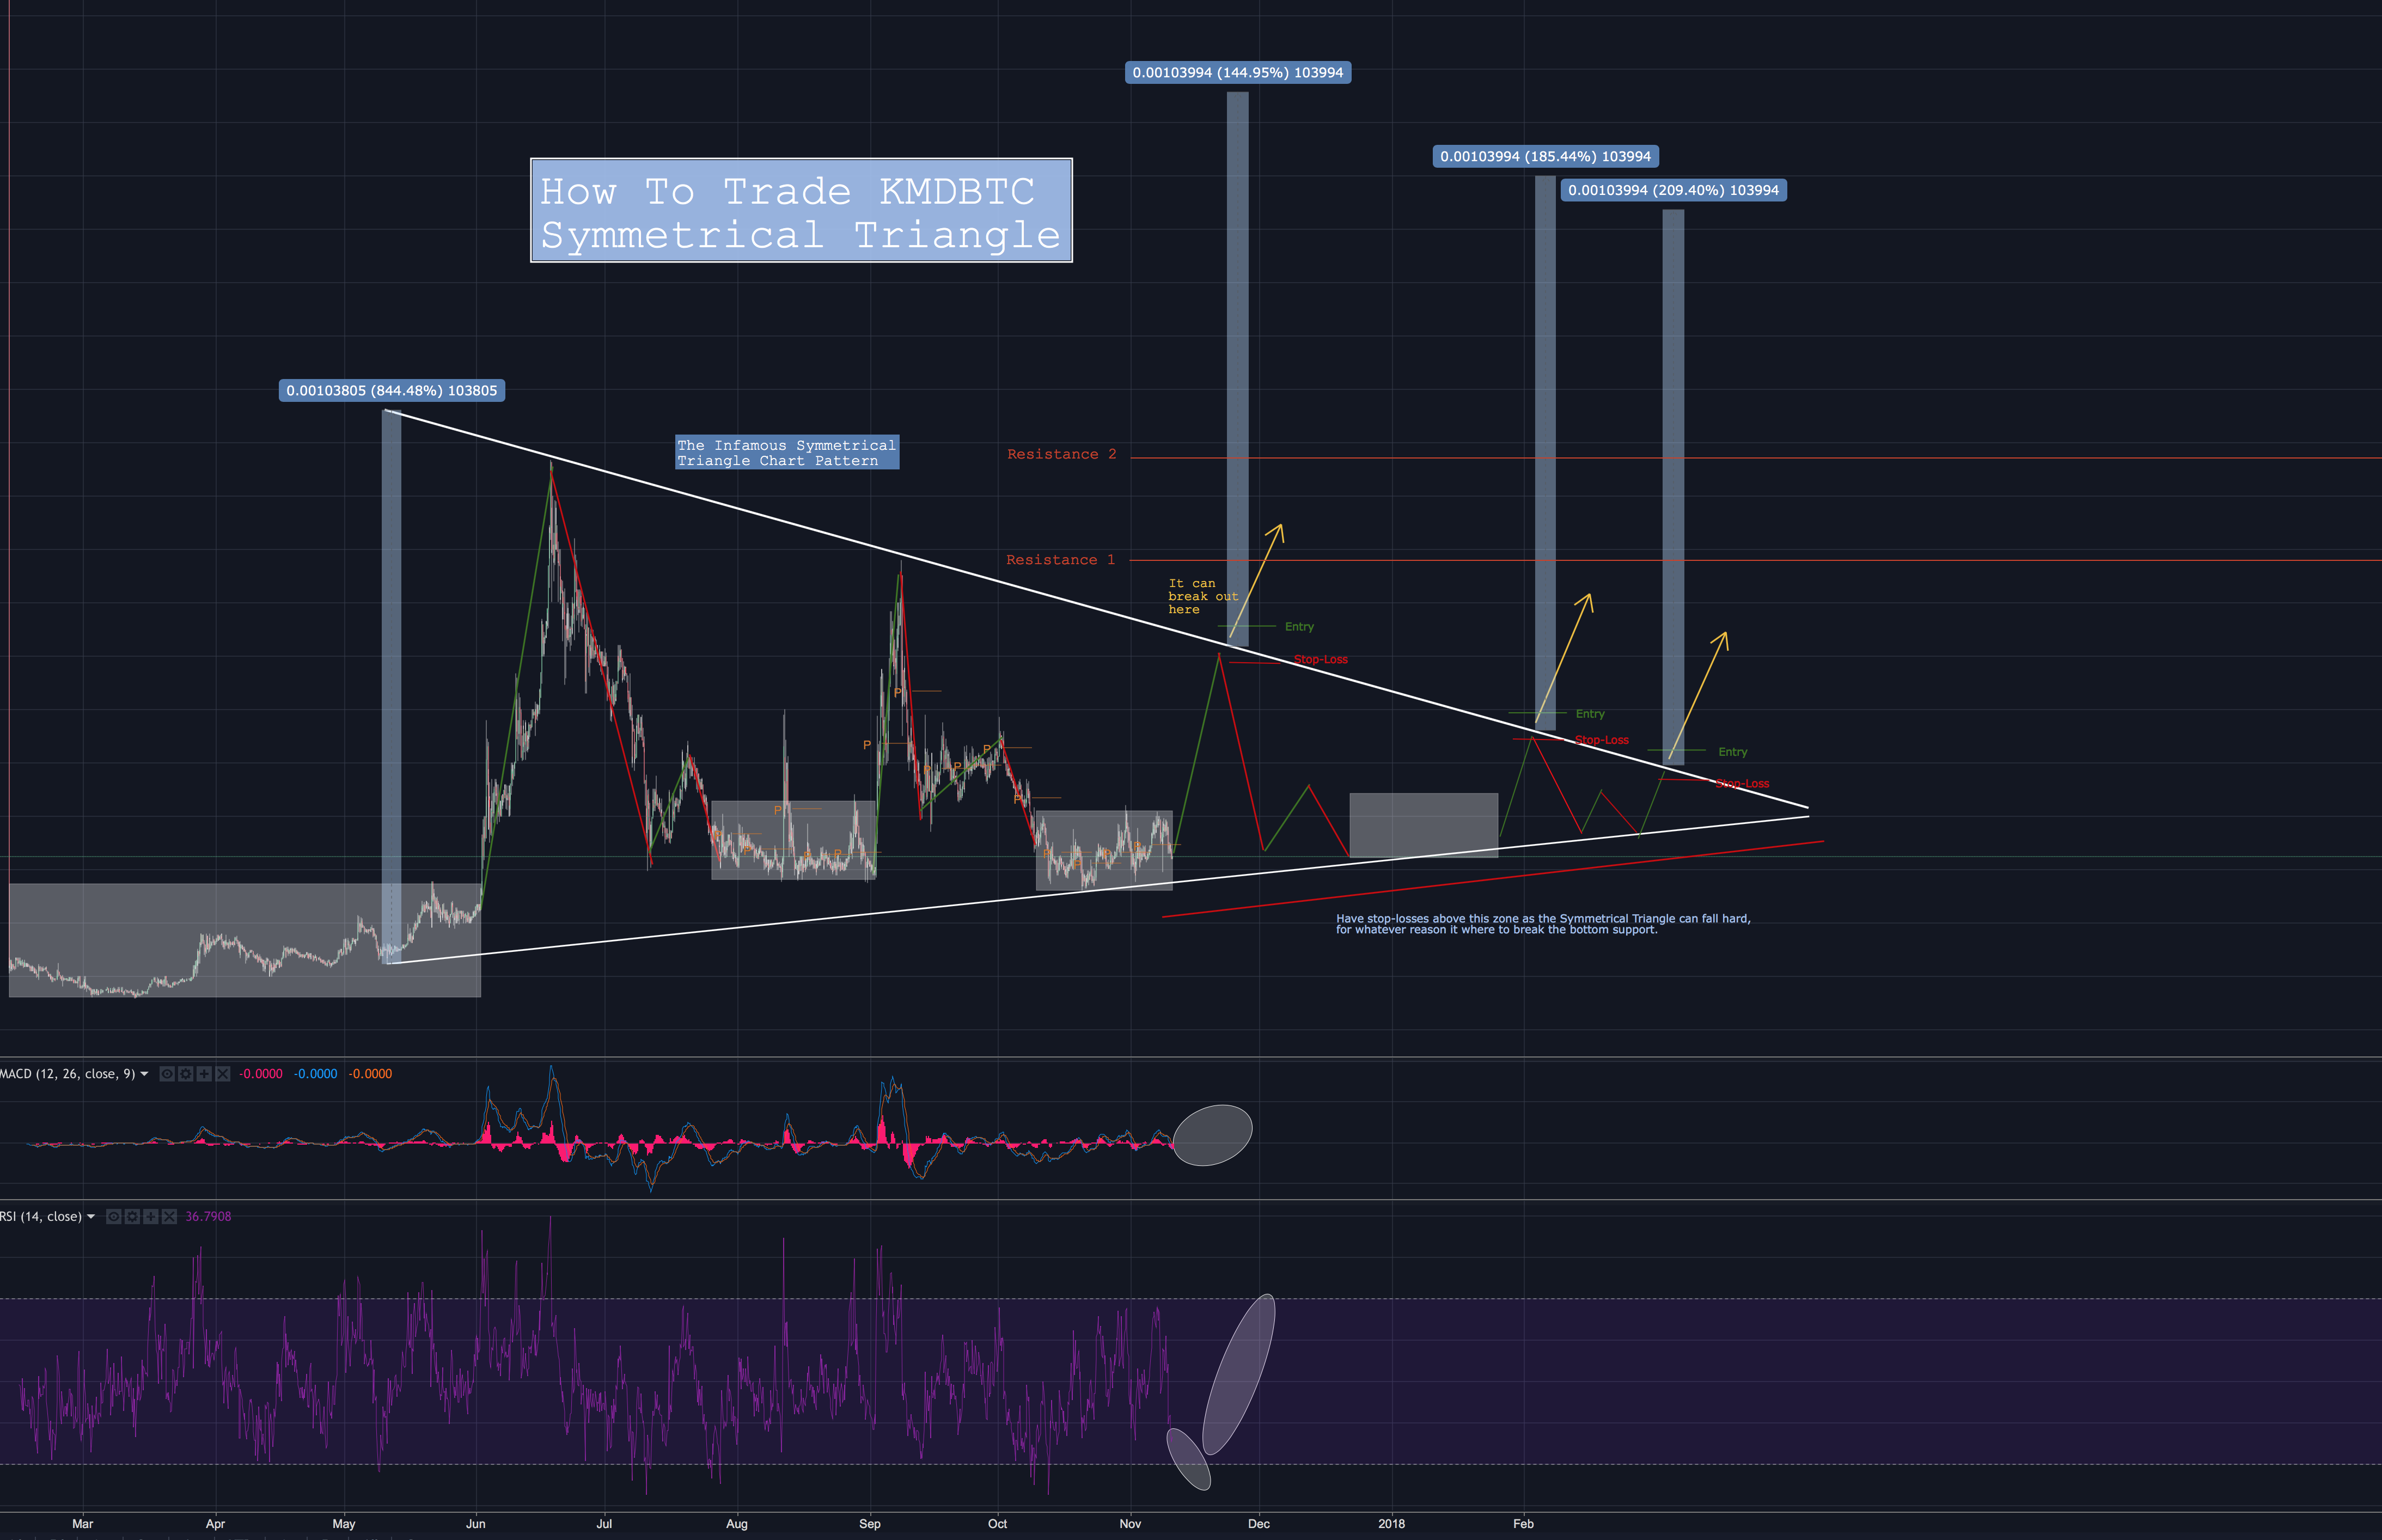
I used lines to mark impulse & correction waves so that you can see price action pattern easily.
Consolidation zones highlighted by white box.
Watch MACD for upward movement.
Watch RSI for upward movement.
This trade seems like it has favorable Risk:Reward and therefore, I will be putting it on my watchlist & setting alerts.
Just be very careful and use stop-losses no lower than slightly below the symmetrical triangle bottom line, as these are known to have aggressive bearish breakouts.
Let's hope that's not the case & see how it plays out.
You can see the full trade at:
https://www.tradingview.com/chart/KMDBTC/fXFsDzBY-KMDBTC-Symmetrical-Triangle/
Nice information bro
Downvoting a post can decrease pending rewards and make it less visible. Common reasons:
Submit