Hello Steemers!
As @ausbitbank asked yesterday if I had some opinions about $MAID and I didn't give it a proper look in quite a while, I decided to chart it today. Again the TA will be based on the chart only, not on news, not on updates or anything else.
Legend
Purple dashed lines - previous resistance which acted as new support, or is about to act
Yellow dashed lines - previous support which acted or should act as new resistance in the coming future
As usual let's start with the view of the whole chart.
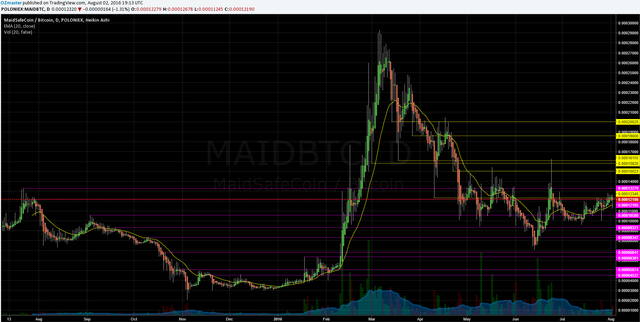
1 day chart Poloniex - 02/08/16
I Marked out the support and resistance levels as always. Most of my daily charts will start of with those.
Once again the chart is very messy, I know, but as the post goes along it will get cleaned up leaving only the most important levels on there.
But first, the thing you all have to get used to at my TA, fiblines!
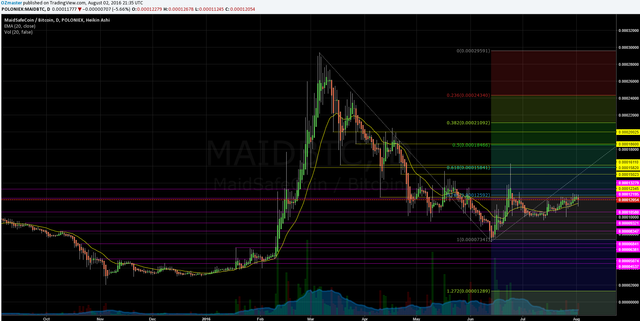
1 day chart Poloniex +fibs - 02/08/16
Again there are a couple of previous resistance and support levels which correlate with the fib lines.
The ones that are overlying with the fib lines or are close to them should be an important level in the coming future.
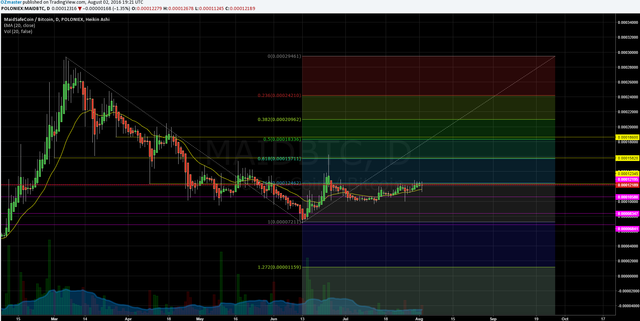
1 day chart Poloniex+fibs+clean - 02/08/16
there are 3 yellow, previous support level, now to act as a new resistance level, lines which near to perfectly overly over the fib lines. Those should act as the major resistance level in the coming future.
After this cycle ended, the lines are not to throw away, they will be used as means to decent new support/resistance levels.
COMMENT
As you can see $MAID had a huge pump, stretching from a 2k satoshi all time low to a 30k satoshi all time high, after which came consolidation.
After approx. 4 months of downtrend, $MAID hit the price of ~7k satoshi which seems to be acting as the new bottom.
It still has some low downside potential with the final support being around 3-4k satoshi, but for now it looks like we entered another accumulation area. That mean's that the price will probably lower it's volatility and start trending sideways with a very weak uptrend after which the next pump cycle should begin.
$MAID, to my knowledge is a project that started way before the crypto era with the ultimate goal to make a decentralized internet, which in my opinion is one of the most ambitious tasks any crypto team has taken upon them to realize. They are providing constant updates and show decent progress, which can also be seen in the price activity.
IMO $MAID is definitely a coin that is going to stick around for quite a while. The price looks healthy and is gaining volume over time which is definitely a positive sign towards a bright future!
If anyone has any questions or need's help fell free to ask, I will try to explain as fast and as best as I can.
Critics, comments, reply's, counters, advice's, etc. are always welcome!
Have my charts helped you in any way?Let me know with a comment below :)
Are there more people who are doing TA?
DISCLAIMER
I am showing multiple scenarios on the price movement, in the post itself I do not take any stance, either bullish or bearish. I am not responsible for neither you’re winning nor you're losses upon trading! the "comment" section is my personal opinion and does not mean I have to or do hold any positions in the given market.
Kind Regards, OZ :)
Aww thanks @ozchartart for the report :D
I'm relieved you're analysis is very similar to my own .. I actually bought a bunch at 8k satoshi's but second guessed myself and bailed out too early, never got back in :o/
Heres my chart with a different fib placement for comparison
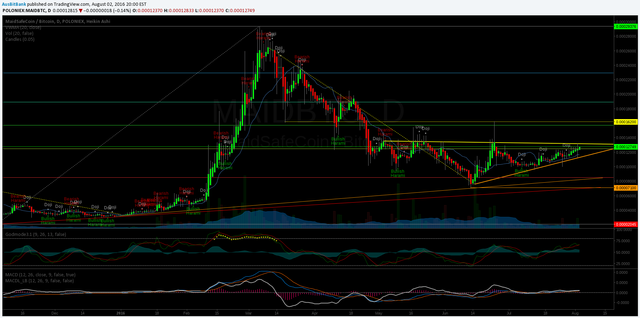
I see a possible inverse head and shoulders happening now, will attempt to buy a breakout above the thick yellow line if it happens I think ..
Downvoting a post can decrease pending rewards and make it less visible. Common reasons:
Submit
rly nice!, ur also keeping track of historical levels, me like it, especially like the triangle u drew there, I have to admit I didn't even notice it! perhaps my mind wasn't looking for them shapes today :)
Downvoting a post can decrease pending rewards and make it less visible. Common reasons:
Submit
Last time I looked at this chart we hadn't touched down to make the orange support trendline yet so it just sorta jumped out at me when I updated it .. Fingers crossed the reverse H&S plays out, I'm spewing I sold
Downvoting a post can decrease pending rewards and make it less visible. Common reasons:
Submit
Hey @ozchartart check out my Cryptocurrency report https://steemit.com/steem/@jholmes91/mr-holmes-cryptocurrency-report
Downvoting a post can decrease pending rewards and make it less visible. Common reasons:
Submit
How do you see this tie in to the Bitfinex hack? What is your current position on the hack and what we'll see after?
Downvoting a post can decrease pending rewards and make it less visible. Common reasons:
Submit
the question was very nice @spookypooky
please answer the questions in @ozchartart
Downvoting a post can decrease pending rewards and make it less visible. Common reasons:
Submit
I think hacks are only used to boost the potential price movement direction
Downvoting a post can decrease pending rewards and make it less visible. Common reasons:
Submit
Its time to buy maid?
Downvoting a post can decrease pending rewards and make it less visible. Common reasons:
Submit
Good information! :D
Downvoting a post can decrease pending rewards and make it less visible. Common reasons:
Submit
My old Elliott Wave Analysis
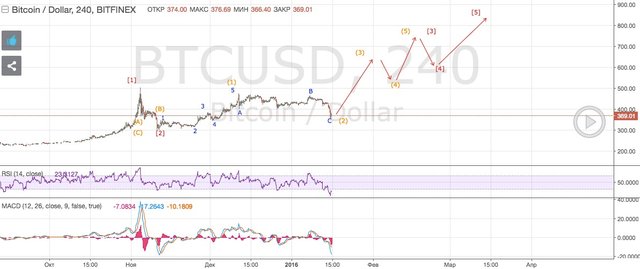
I created this in January
Downvoting a post can decrease pending rewards and make it less visible. Common reasons:
Submit