VIDEO ANALYSIS
https://www.tradingview.com/chart/XRPUSD/4HLCapYf-Ripple-Analysis/
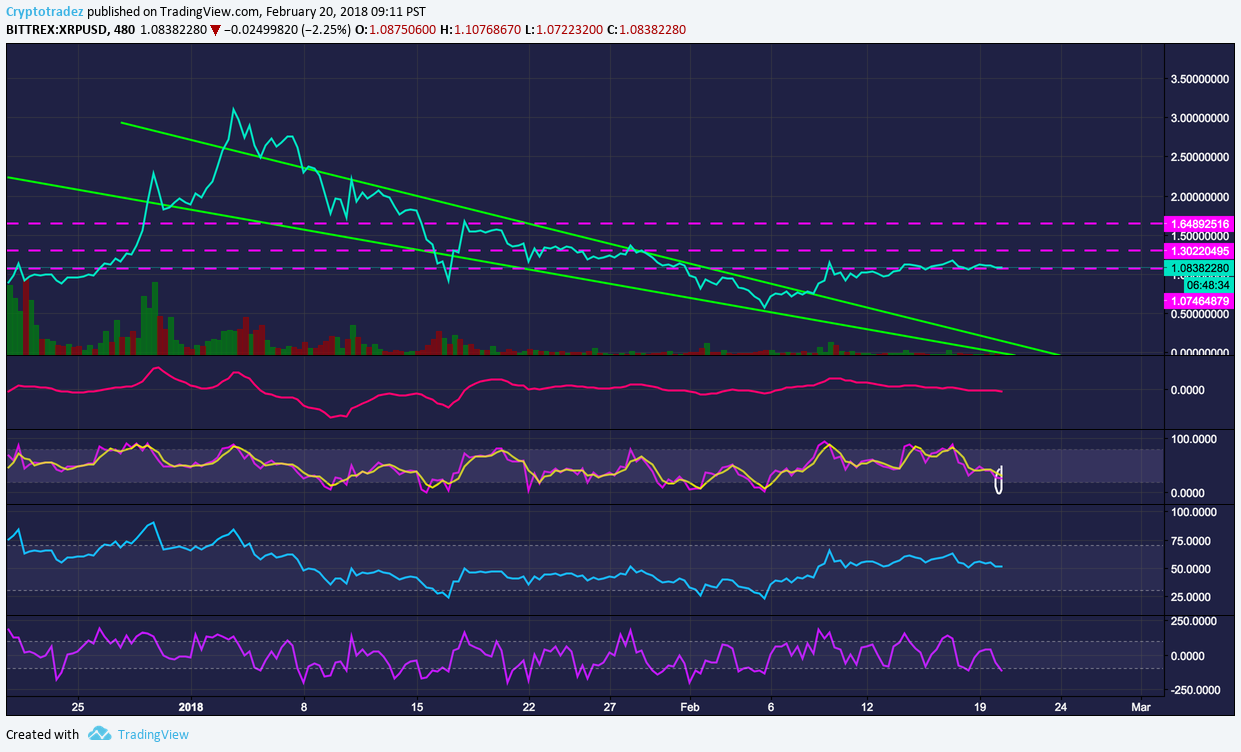
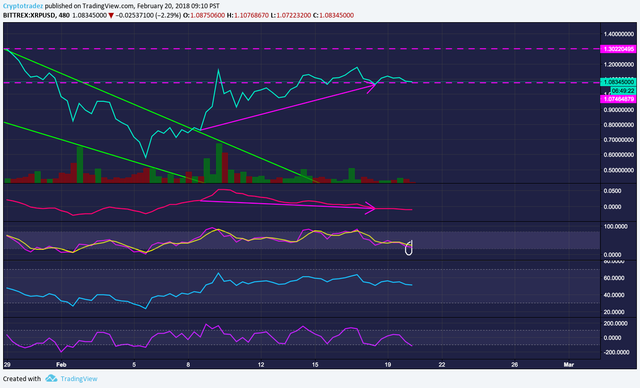
Falling Wedge break should bring us to 1.65 cts 1.43% eventually.

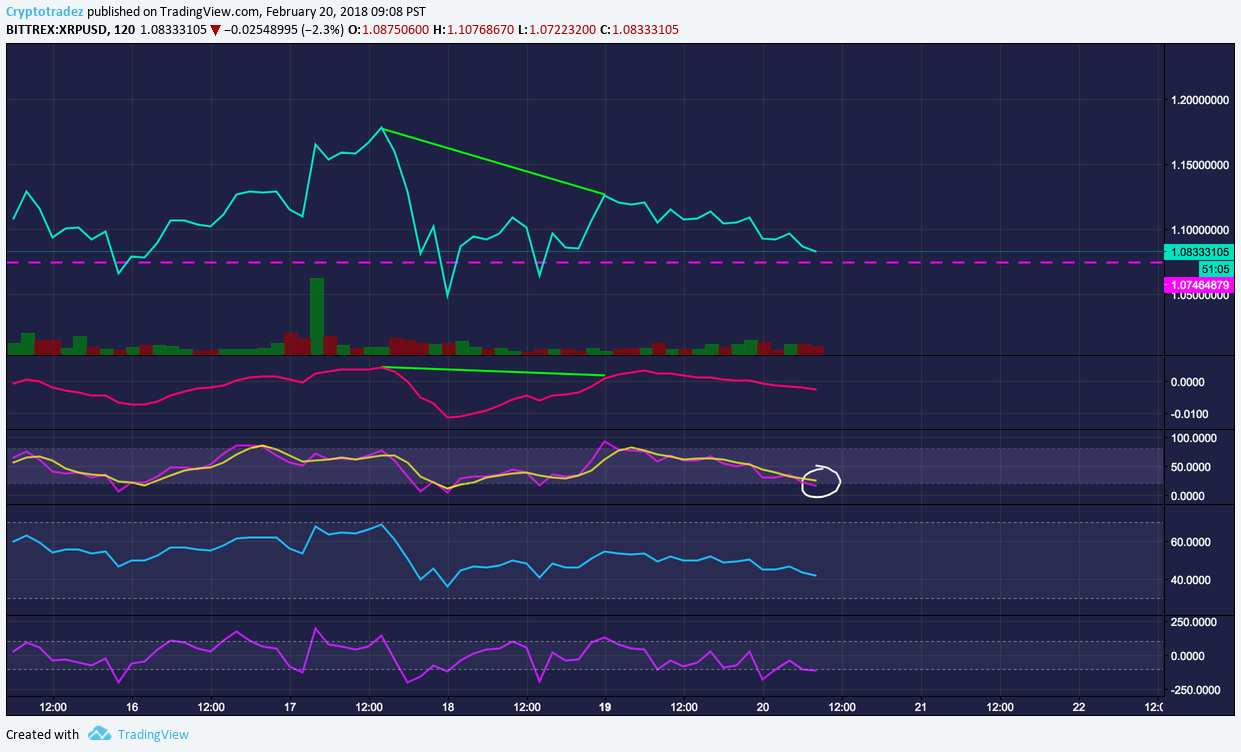
On 2h chart, we have a good Hidden Bullish Divergence that tells us that Ripple should go to the 1.30 for the 2nd of March or earlier.

Right now, the price has fallen down because a Bearish divergence was materializing. We should be done with that soon.. Let's keep an eye on the Stoch as a signal to where the price is moving.
