Hello Steemers!

Went ahead and did a Siacoin ($SC) chart today.
SC is ranked 46th on coinmarketcap and has been traded with quite nice volume and volatility so far.
Fore more info about Siacoin check out their website and their Bitcointalk thread:
Website - http://sia.tech/
BCT thread forum - https://bitcointalk.org/index.php?topic=1060294.0
Starting of with the clean charts, I will be showing the weekly and the daily ones.
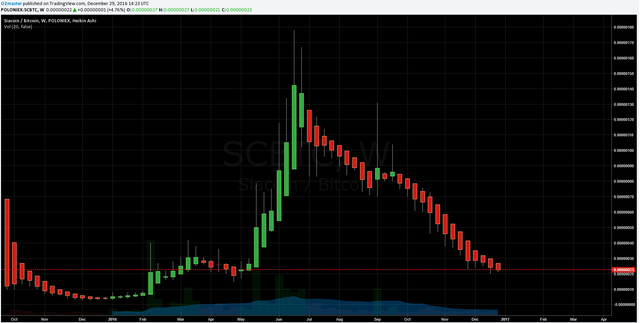
weekly chart Poloniex -clean - Dec. 29, 2016
We can see how SC has undergone sell pressure in the beginning and then after reaching a bottom of 3 satoshi started slowly turning than made the first pump to 40 satoshi, around which level it settled for a while and start going back up with even higher force.
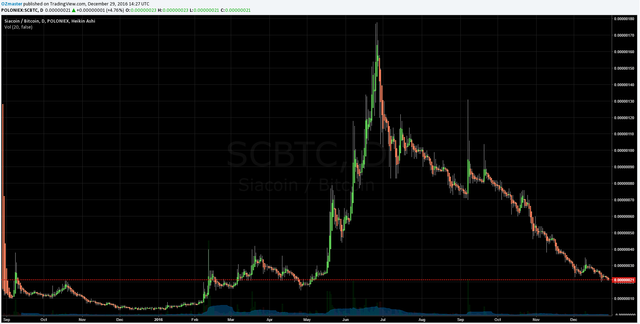
daily chart Poloniex -clean - Dec. 29, 2016
After reaching the peak on 178 satoshi it started going down pretty fast. With a few bounces along the way it has for now marked a new local low of 20 satoshi and is traded slightly above it.
Adding some lines to the chart.

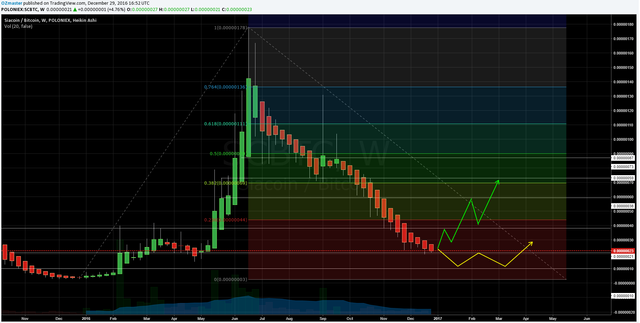
weekly chart Poloniex -lines - Dec. 29, 2016
With the lines on the weekly, we can see the bottom accumulation zone reaching nearly up to 10 satoshi, then a gap to 20 satoshi which the price has nearly totally skipped, after which comes the ztone up to about 40 satoshi where the price has been trading after the first run up and is at the movement.
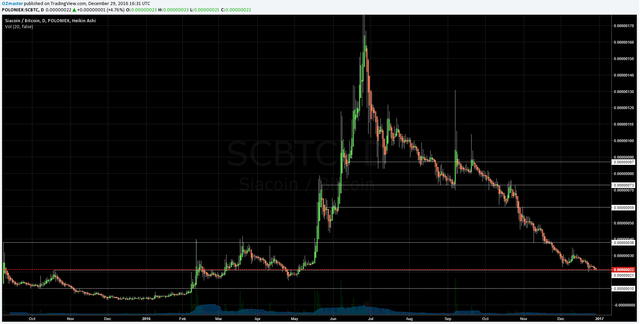
daily chart Poloniex -lines - Dec. 29, 2016
On the daily we can see how after making the pump the price used some levels to do slight bounces, and then progressed further down through them , first the 87 satoshi line, then the 73 one, then the 59 one and finally it went bellow the 38 satoshi line which seems to be marking a important support/ resistance border.
Adding the fib after the lines again.
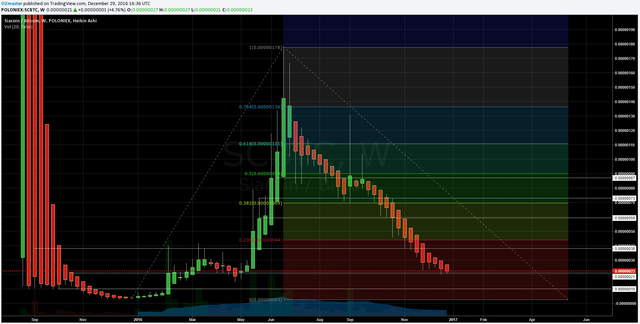
weekly chart Poloniex -fib - Dec. 29, 2016
With the fib on we can see a major accumulation level possibly going up to about 40-45 satoshi, with one above it topping at about 75.
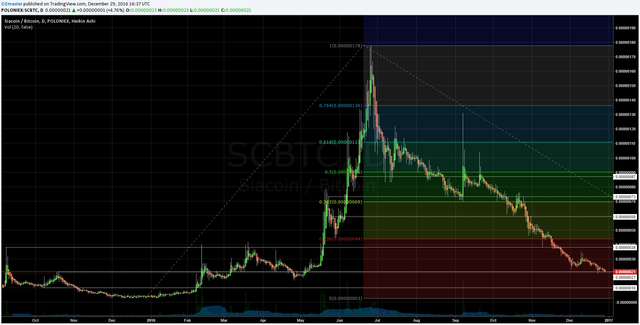
daily chart Poloniex -fib - Dec. 29, 2016
What to expect?
1st (green) - The price has marked a new bottom with the newly made local low on 20 satoshi and will start a reasonably strong uptrend after turning and start progressing through the first 2 accumulation zones rapidly.
2nd (yellow) - The price goes further down to about 10 satoshi where it starts slowly turning, then trades between 10 and 20 satoshi on the lower half of the major accumulation zones and then breaks upwards in the upper half slowly progressing on.
COMMENT
Once again, I will post the comment by commenting as it involves my personal opinion!
Thank you for understanding!
If anyone has any questions or need's help fell free to ask, I will try to explain as fast and as best as I can.
Critics, comments, reply's, counters, advice's, etc. are always welcome!
Have my charts helped you in any way?Let me know with a comment below :)
Are there more people who are doing TA?
Please post the links to your TA's posts into the comments as well!
DISCLAIMER
I am showing multiple scenarios on the price movement, in the post itself I do not take any stance, either bullish or bearish. I am not responsible for neither you’re winning nor you're losses upon trading! the "comment" section is my personal opinion and does not mean I have to or do hold any positions in the given market.
Everyone who uses TA develops his own unique charting style, please keep that in mind.
Kind Regards, OZ :)
Resteemed
Downvoting a post can decrease pending rewards and make it less visible. Common reasons:
Submit
COMMENT
Expecting the price do drup even further down to about 10 satoshi (what seemed to be the
top of the pre uptrend era) and slowly start turning from there, starting of with some accumulation bellow
the 20 satoshi line and then progressing up into the tzone which tops around 40 satoshi.
Downvoting a post can decrease pending rewards and make it less visible. Common reasons:
Submit
hardly a day goes by without me learning about a new coin!.thankyou
Downvoting a post can decrease pending rewards and make it less visible. Common reasons:
Submit
I understand bitcoin and Steem but little after that. I don't know a lot about trading them. What are the best resources for getting into trading on micro movements? Thanks!
Downvoting a post can decrease pending rewards and make it less visible. Common reasons:
Submit
Thank you for this
Downvoting a post can decrease pending rewards and make it less visible. Common reasons:
Submit