Nodeutter

NodeUtter is a social media website where it utilizes the timeline of a person or a hashtag to generate graphs for the user that describe his/her life at a glimpse, or it could be a hashtag, by showing different graphs and figures it really summarizes the performance of a certain variable of a hashtag or a person.
In this blog post we will see three different aspects of this social network with a figure to only illustrate it:
The personal profile
The Hashtag generated page
Newsfeed
This website is also for sharing thoughts, sharing pics and videos, sharing links and stories and chatting among friends.
So, let start talking about the first aspect of this social media which is:
I.THE PERSONAL PROFILE
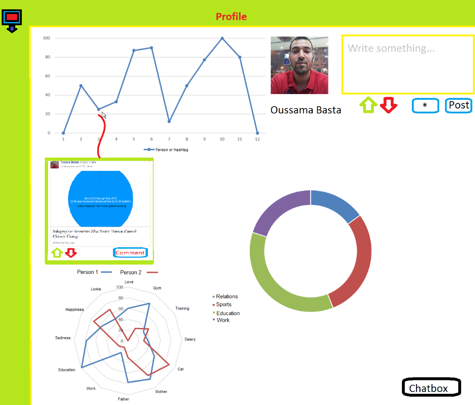
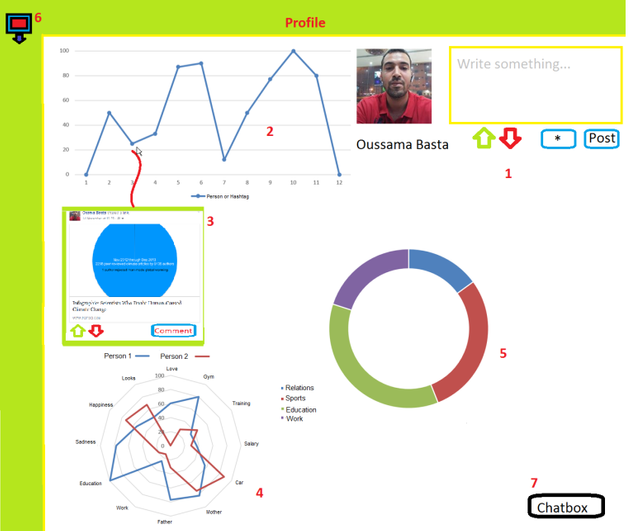
As in figure 1 the profile page and just like any social media has the basic info like name and personal picture and some space where you can make new posts which are signified as element (1) in figure 1. the user may choose if the event is a major event by selecting the star button.

Figure 1
And if a person presses on the name of the person it will take the visitor to another page where the visitor can see more details about that person, in the element 1 the person who owns the profile can put point to the post according to the person’s evaluation and the points can range from 0 to 100, all that can be done using the red and green arrow.
When the user adds a post, element 2 updates automatically and draws a new point on its graph in which its position is in accordance to the points that the user have chosen. If the user chooses to make a point as a major point it will show a red dot instead of the regular blue When the user or profile visitor hovers the mouse on any point on the graph it shows the post as a popup window on the page, and the profile visitor may add or remove points to the post or comment or share as shown in element 3.
If a person clicks on a major point the site will take him to a separate page where it will show same graphs but customized by the user who added the point, so for example: I add a point about my marriage date and choose parameters like #suit_color and #emotions and #happy and #wife.
The result will be that there will be a pie graph and a radar and normal graph shown for those parameters or hashtags, the normal graph will show the different stages of this marriage like getting engaged and anniversary and having the first child events and etc.
Element 4 which we call the radar shows different parameters and the average points they got across the years. Element 5 is what is called the pie graph and it contains what is the most dominant parameters in someone’s life.
Element 6 is where the user may change all kinds of settings
Element 7 is where the user can chat with his/her friends
- THE HASHTAG GENERATED PAGE
The hashtag generated page is a page which also includes the three graph types and the user may choose the hashtag that he needs and the site will ask for the different parameters the hashtag may have we will call them here subhashtag, and after the user chooses the hashtag and the subhashtags, the first graph which is the normal graph will have the hashtag itself and the other two graphs will contain the subhashtags as parameters to the graphs
3.NEWSFEED
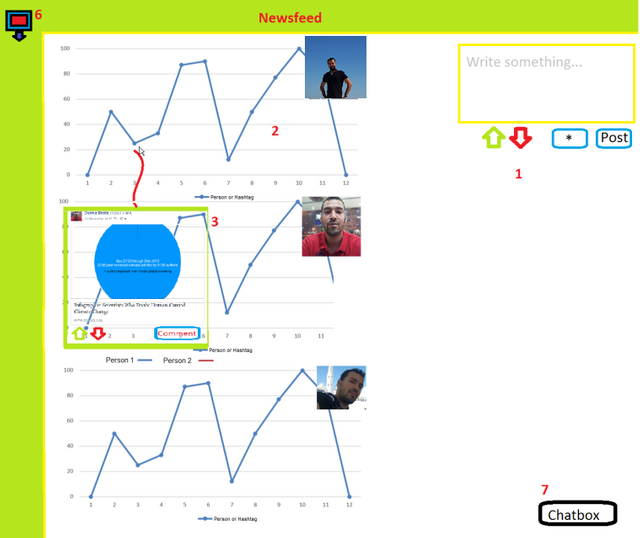
In the newsfeed the user may just see the different type of graphs as a stream, and all graphs are interactive.
