
It was a volatile weekend for cryptocurrencies and the STEEM price took some relatively heavy damage.
A correction was expected in the markets after the rather large runs that most cryptocurrencies had over the past couple of months. There is a lot of data to consider right now, so let's get right to it.
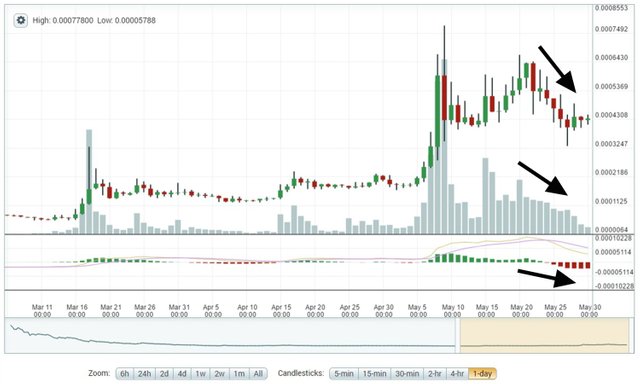
On the first chart, we can see the declining STEEM-Bitcoin price, volume, and momentum. The negative divergence in momentum was fairly strong and it still points slightly downward. However, it does appear to be flattening out, which could be a good sign for short-term price action.
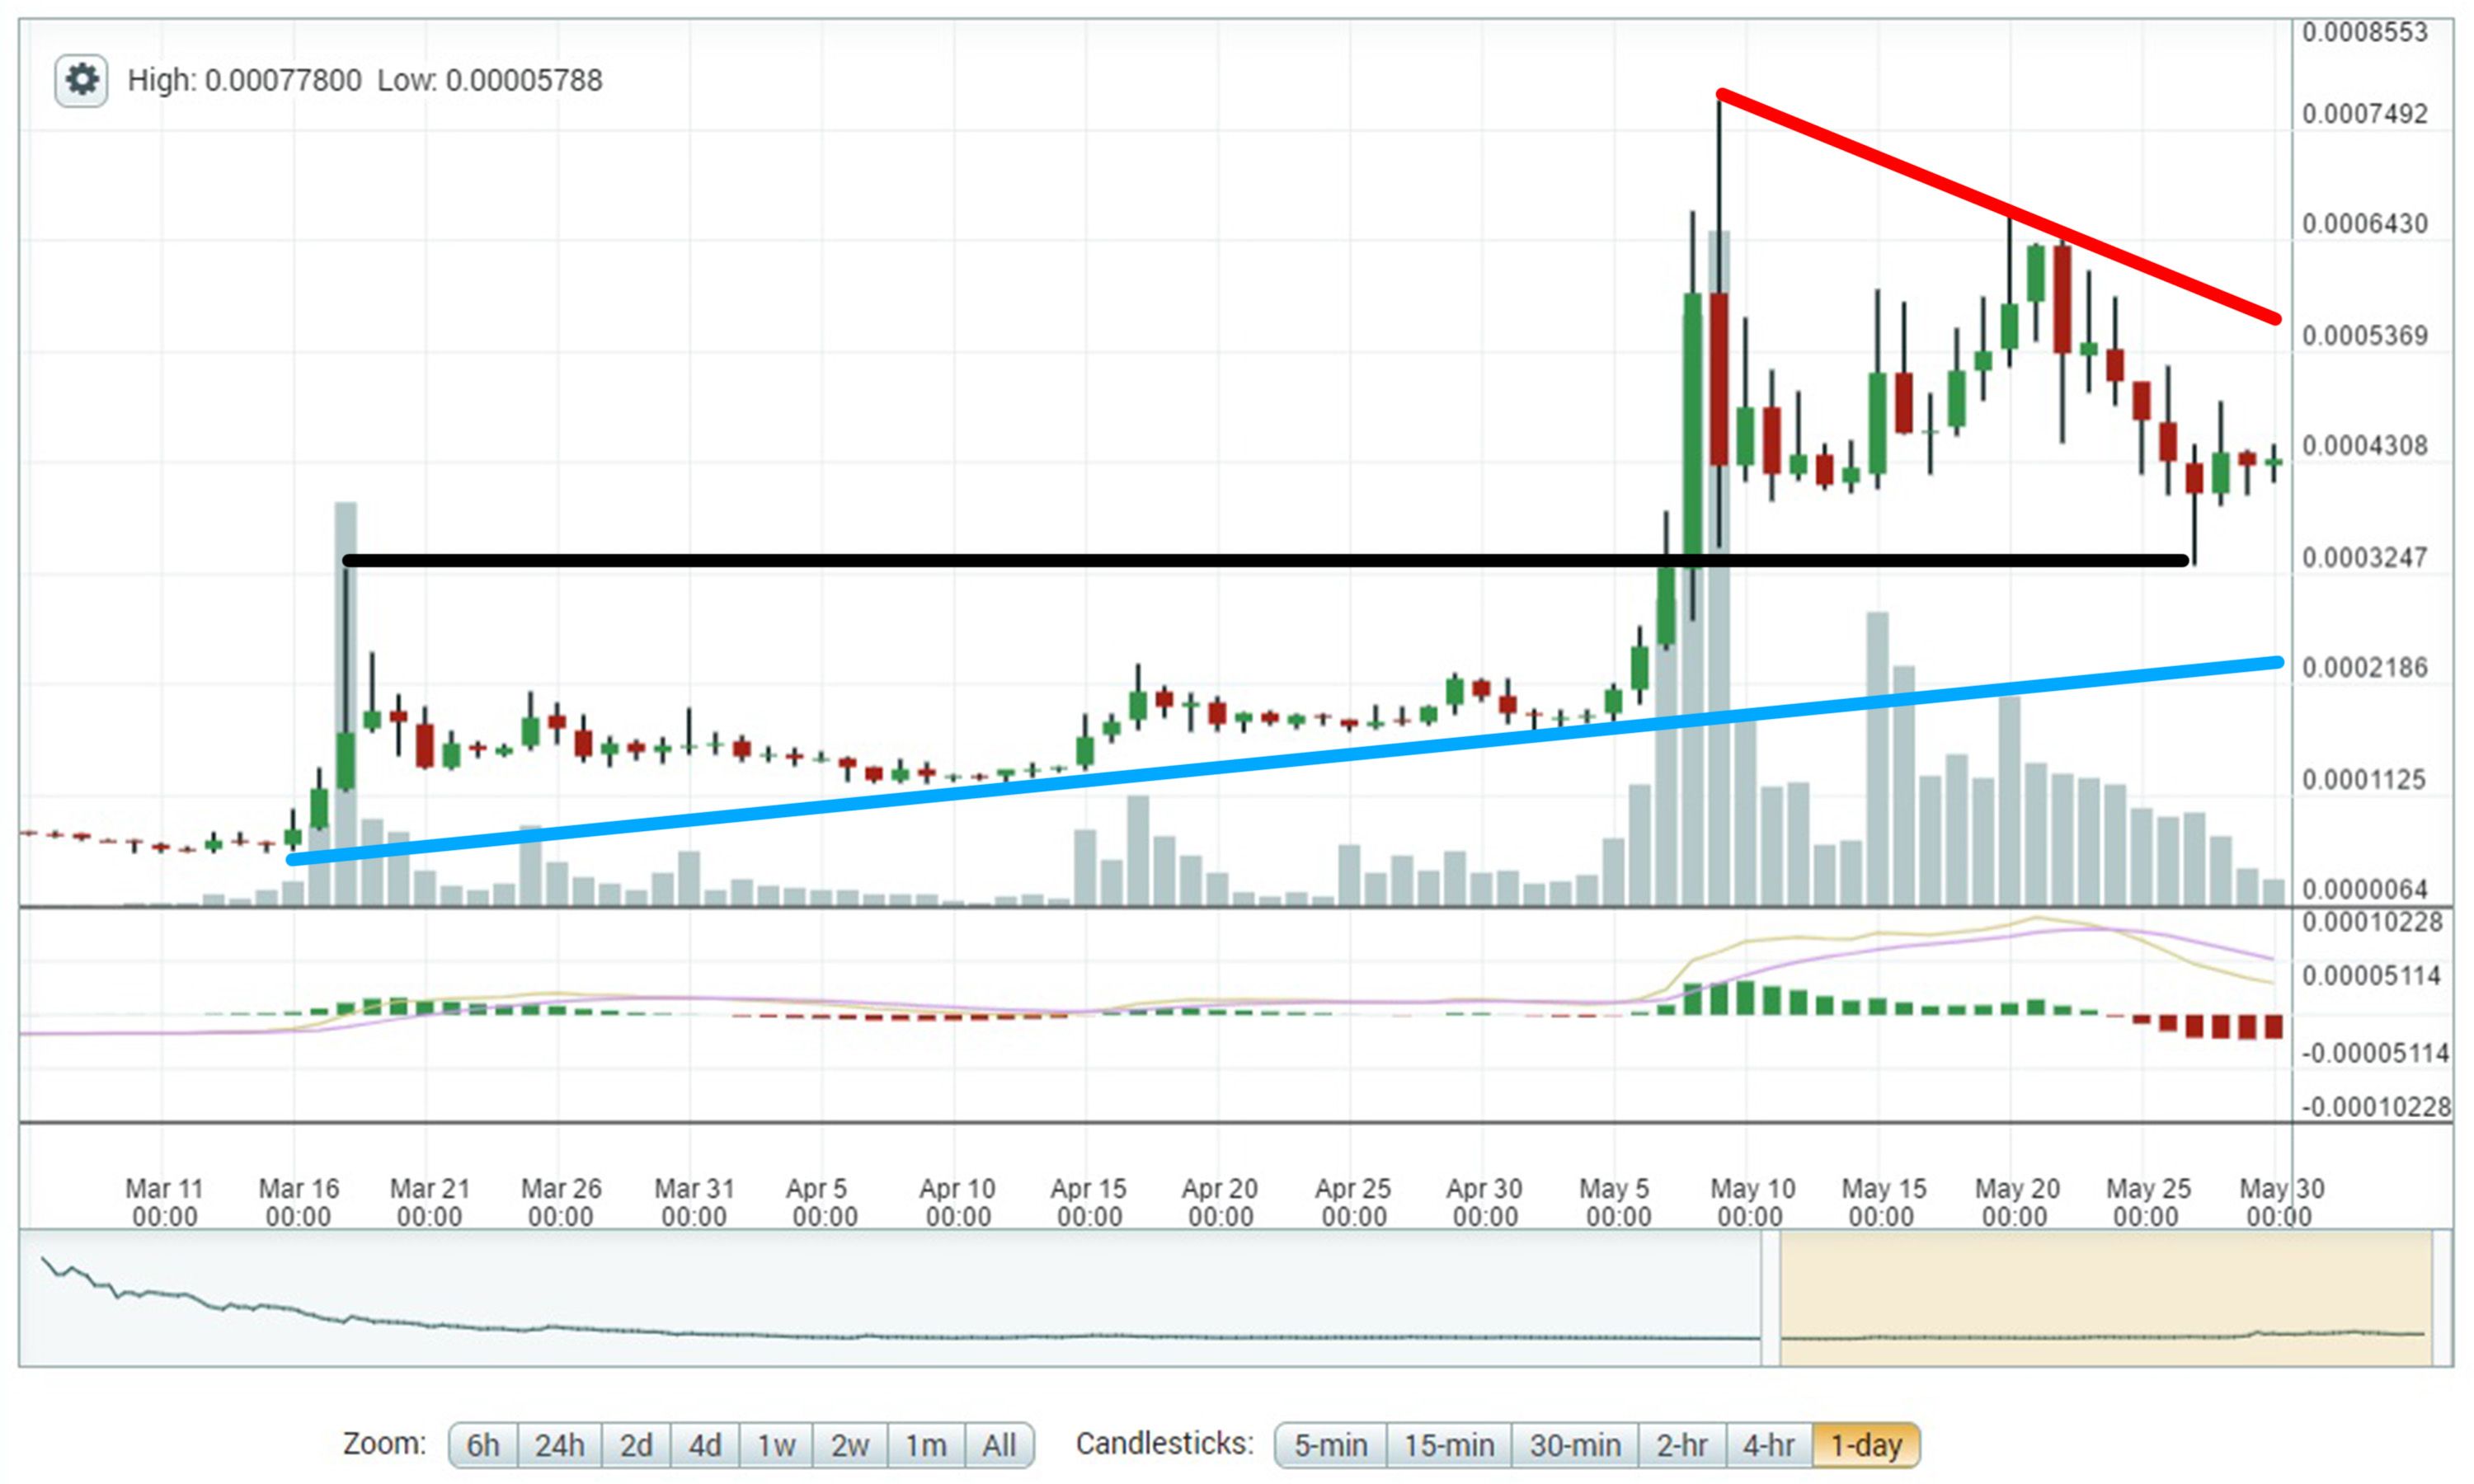
Despite the recent drop in prices, it should be pointed out that the long-term uptrend that began in mid-March is still fully intact (blue line, chart below). The STEEM-BTC price is well above that uptrend line and it would need to be cut nearly in half from current prices in order to be in jeopardy.
Over the past two weeks, I mentioned the 33K satoshi support line (black line) that would likely catch any strong push under 40K. That is exactly what happened on Saturday, May 27th. The intraday price touched off of 33K very briefly and then quickly returned to 40K satoshis. (For further information on what that might mean for future price action, see this post from @scaredycatguide.)
That being said, we still need to be aware of the donwtrend line coming off of the previous highs on May 8th and 9th (red line). A break through that with a return to higher volumes would be a good indication that the price intends to resume its upward trend and reach new highs.
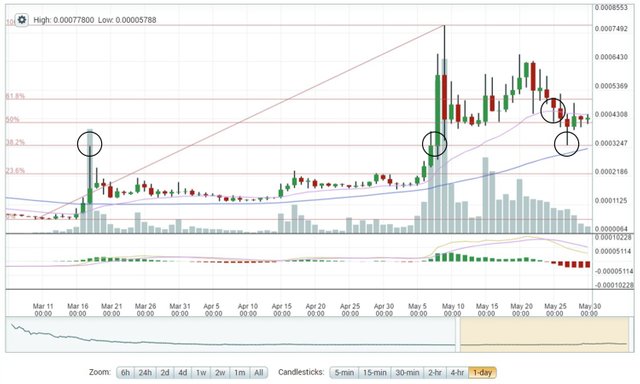
Looking at the more technical data, we can see that the STEEM-BTC price should have found some solid support and does not intend to trade lower than ~33K satoshis for now and will likely stay above ~40K. Going back to the highs reached in March and looking at the Fibonacci retracements, we can see support lining up at 33K - which also happens to be the 38.2% retracement line for the entire move from the lows in March to the highs in early May. There is also a lot of trading occurring along and around the 50% retracement line.
Looking at the moving averages, the STEEM-BTC price has been trading well above the 50-day (blue line), but it broke below the 20-day last week (red line). Over the last couple of days, that 20-day moving average has been holding the price back.
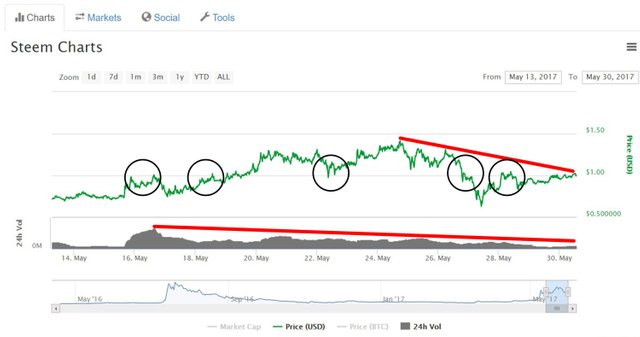
On the STEEM-U.S. Dollar charts, we can see that the long-term uptrend line is still very clearly intact and pointing at a current price of ~$0.35. The price would need to fall a long way to break that uptrend line and I don't believe that will happen in the near-term. There appears to be some fairly strong support at just above $0.65, so any sharp drops should be caught there for now.
On the top side of the chart, the price made a breakout above previous highs over $1.40, but it was a false breakout. The price immediately dropped to that $0.65 - $0.70 support and quickly recovered to the $1.00 range.
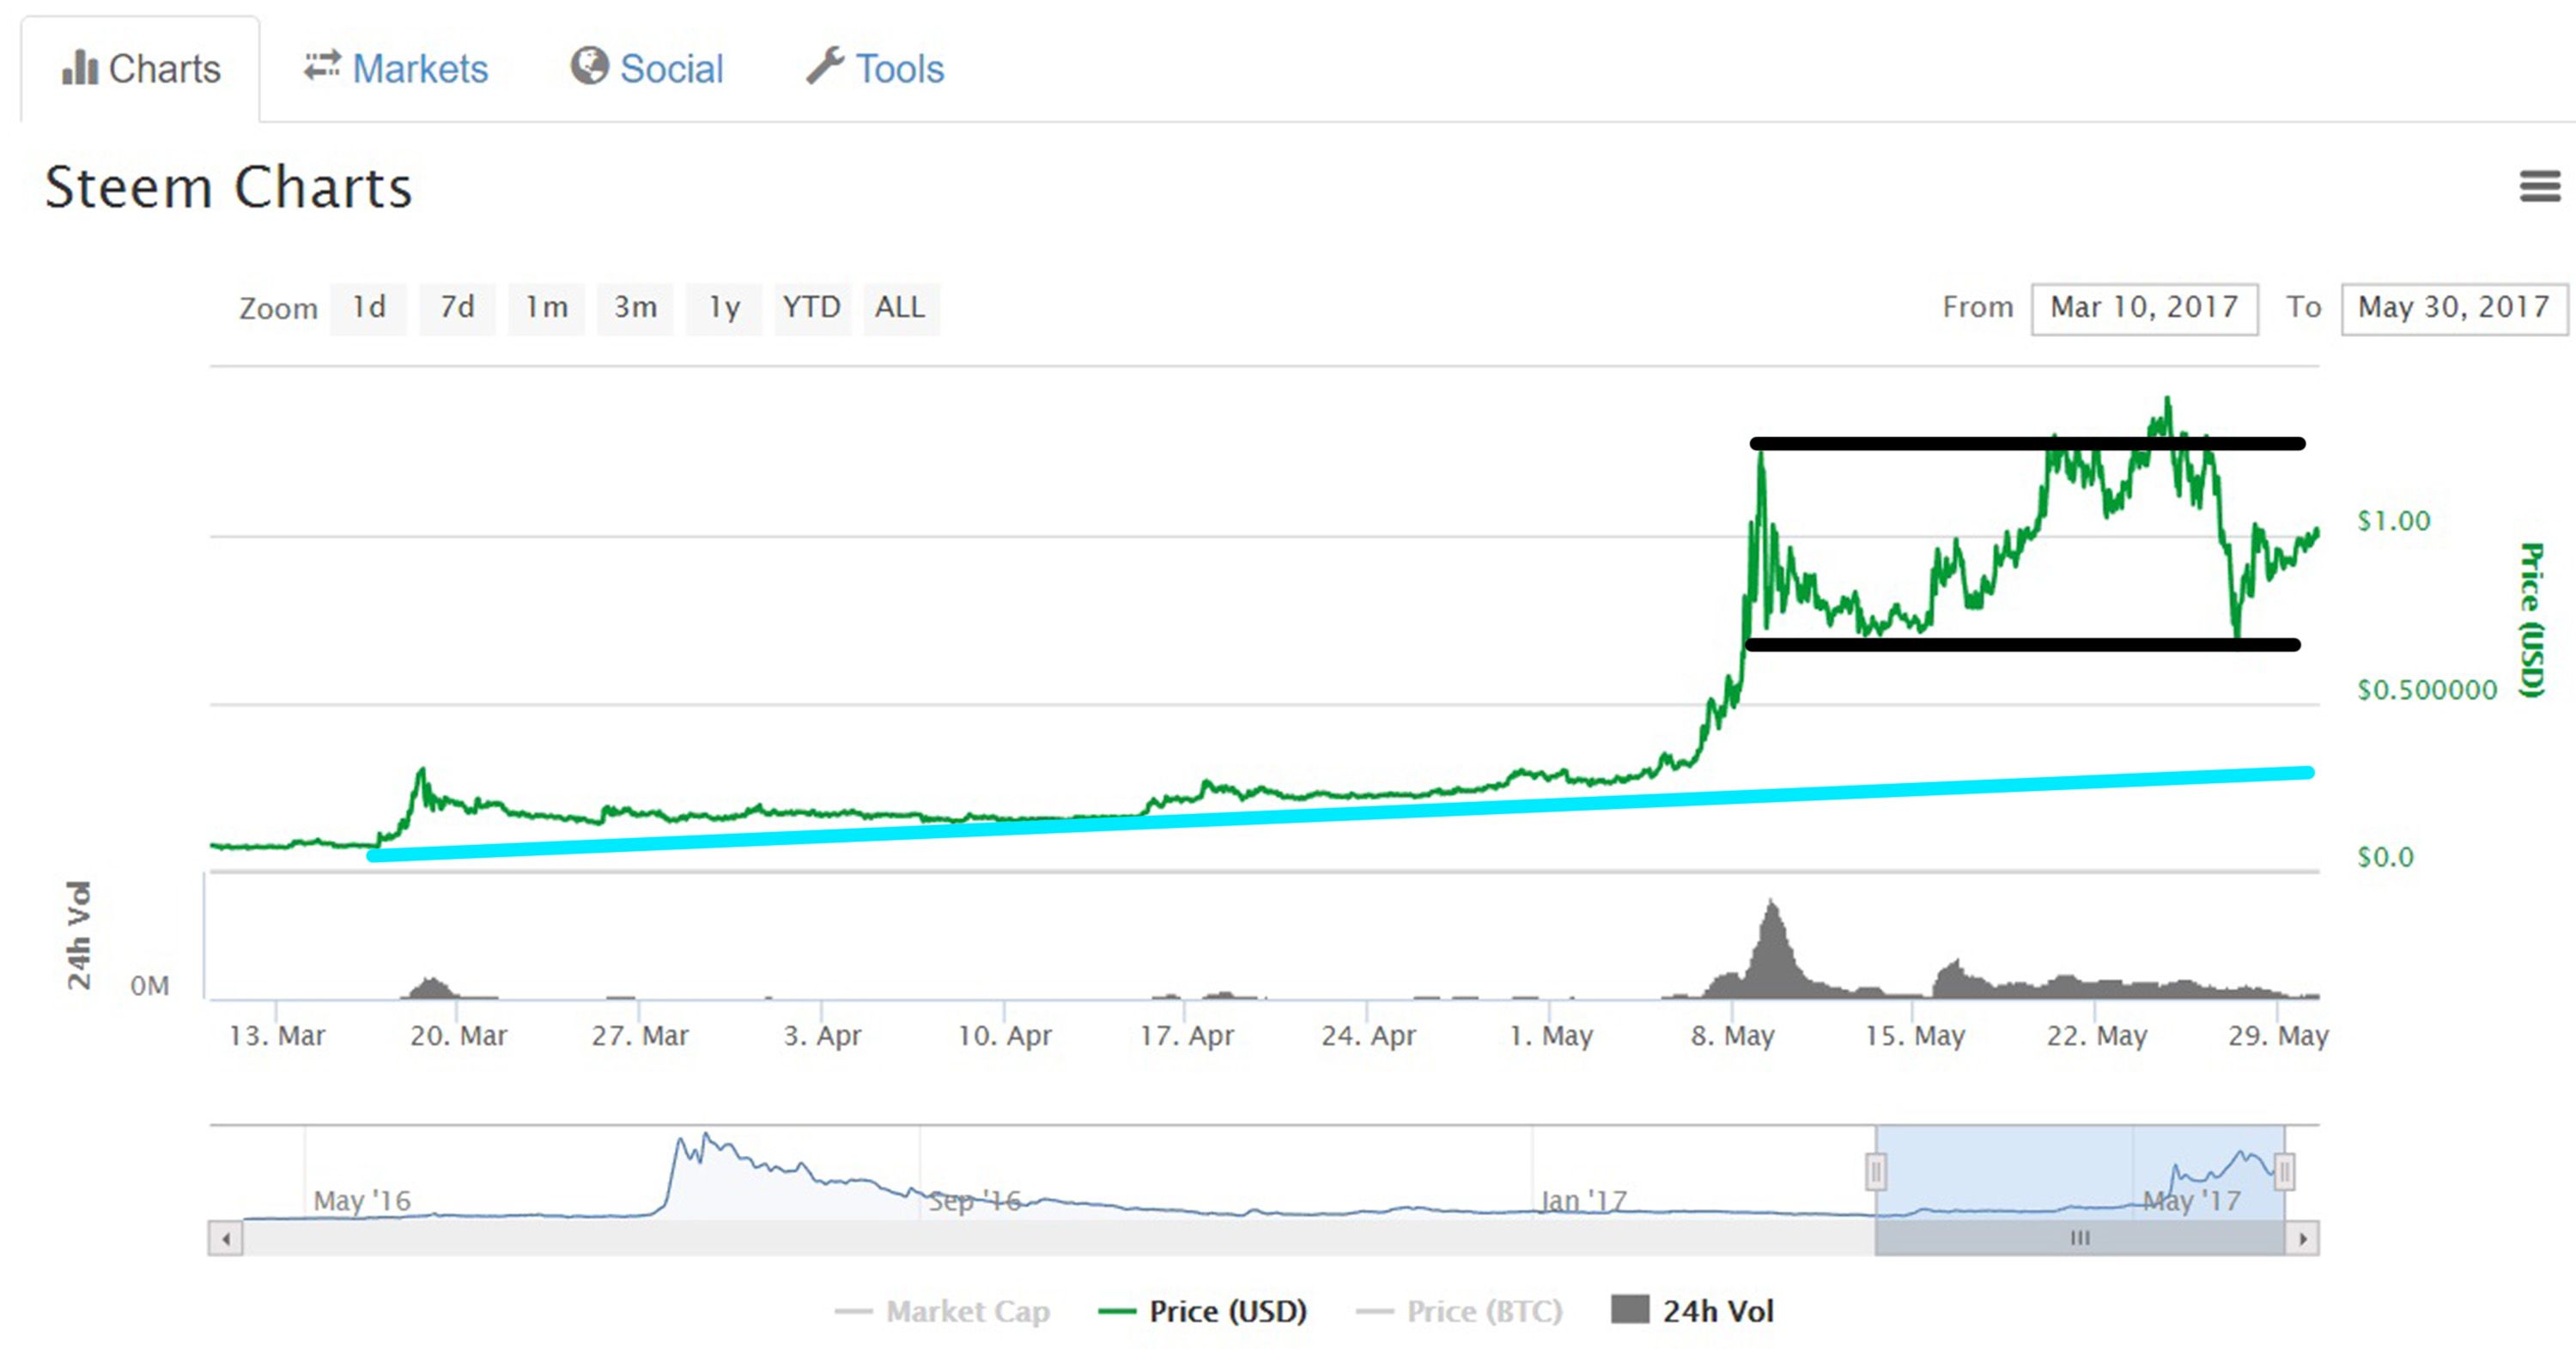
There is a clear downtrend in the STEEM-U.S. Dollar price, but the price is moving sideways to slightly up and is either on the verge of trading out of that downtrend or touching off of it and continuing its decline. The $1.00 line has been a line of both support and resistance over the last couple of weeks and it has served as somewhat of a jump-off point on a few occasions in both directions. Once again, we would need to look for an increase in volume with a strong move over $1.00 to confirm that the long-term uptrend has resumed.
Ideally, a move above $1.30 would be a strong indicator of a resumed uptrend and likely reaching new highs, but that's not likely to occur in the short-term.
What can we expect over the next few days?
The STEEM-BTC price was in a pretty strong downward move, which was expected to happen at some point after such a strong performance from all cryptos over the past couple of months. Currently, the price is attempting to trade out of that short-term downtrend. Over the last 24+ hours, the price has traded in a relatively small range between 41K and 45K satoshis, albeit on relatively low volume.
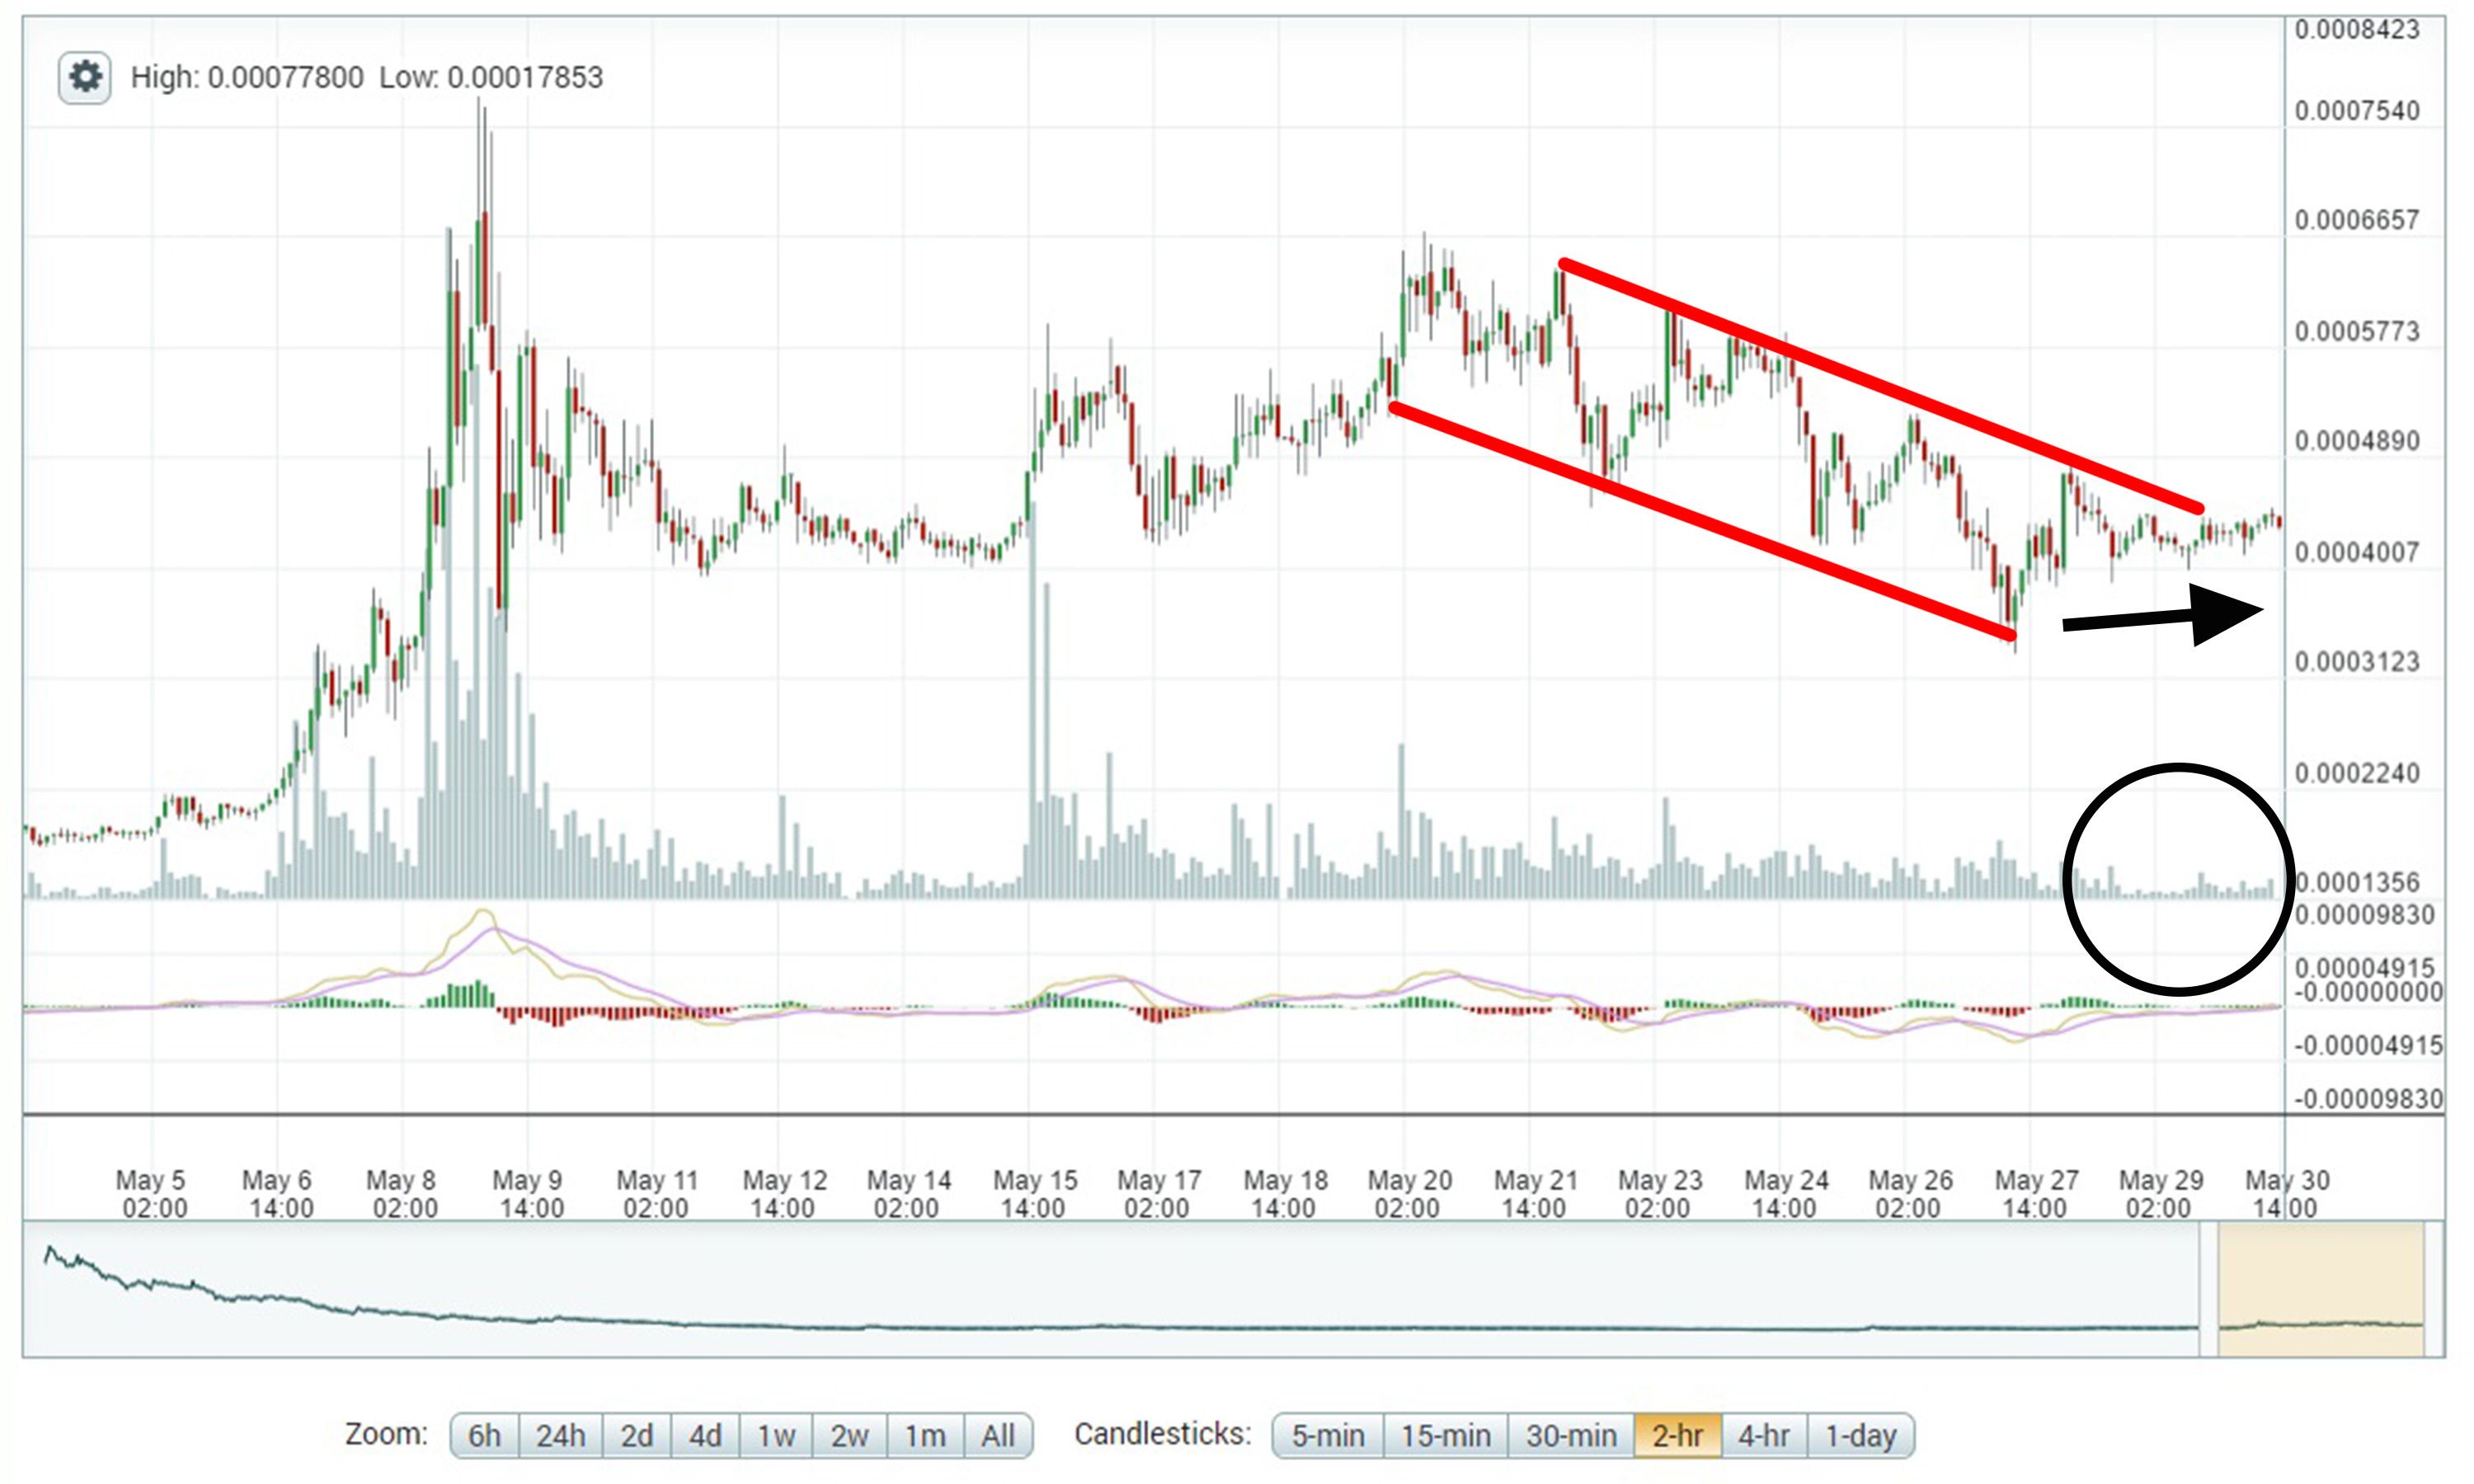
If the price can continue trading sideways to slightly up, it will be out of that downtrend soon and will likely be either range-bound between 40K and ~53K satoshis, or it could move slightly upward to trade between 43-44K and 57-58K satoshis once again.
If the price cannot break out of that downtrend line, we could see it revisit 37-38K and even fall back down to 33K satoshis.
Volume will be the likely indication of which way the market wants to go. If it spikes upwards on a move in either direction, then that should tell us if we're going to see higher or lower prices in the near-term.
If both the STEEM-BTC and the STEEM-U.S. Dollar charts can confirm a break from the recent downtrend, then we should see some stability in prices and possibly a move upward, even with the relatively low volume.
Prices are a bit dicey here, but they at least appear to have found support at current levels. Any moves below have been short-lived. My advice would be to watch that volume. A lot of traders seem to be sitting out right now. When they decide to get back in, we'll know what their sentiment about STEEM will be.
If you're trading, always remember:
Never invest or trade what you cannot afford to lose and put tight stop-losses in when prices creep lower towards the support lines.
As always, if you have any critiques or comments about my non-professional analysis, please let me know. If you decide to trade this market, good luck to you!
Disclaimer: I am not a professional adviser and this info should not be used for trading. These are only my interpretations and opinions, and while I would be flattered that you think so highly of my fairly basic analysis, it would not be prudent to use this for transacting/trading with real money.
*Charts are from Poloniex and Coinmarketcap.com. Analysis is current as of approximately 12:45pm EST, May 30, 2017.

David thank you for analyzing the Steem price! We are very likely to see a Steem breakout from where it is at now as soon as traders become educated about the real value of Steem and more users join our website! $10 for Steem in 10 months I think meaning now is a great time to buy!
Downvoting a post can decrease pending rewards and make it less visible. Common reasons:
Submit
Hey David, great and solid analysis. I used to be a trader back in the day, but for Steem, purely holding and accumulating as I can.
I am glad to see the price at a dollar where it should have been a while back, but with every other crypto rising as well, I feel Steem should be valued much higher. We shall see!
Downvoting a post can decrease pending rewards and make it less visible. Common reasons:
Submit
Excellent analysis; a fair, level headed and detailed overview, backed up by the data.
Downvoting a post can decrease pending rewards and make it less visible. Common reasons:
Submit
Thanks!
Downvoting a post can decrease pending rewards and make it less visible. Common reasons:
Submit
Solid analysis @ats-david. If steem can consolidate in this range while the 50-day ma and that longer term uptrend line catch up we will be in good looking shape. I'd even feel ok if we test 33k again when the uptrend line has reached the area to provide additional support.
Thanks for the post mention, much appreciated!
Downvoting a post can decrease pending rewards and make it less visible. Common reasons:
Submit
Yes, additional support is always a good thing, in my book. Although, I wouldn't be too upset if the support line stays higher. I like the current prices, especially in Dollars. I think hovering around $1.00 for an extended period is a very good thing if it can hold. In fact, I think recent price movements may be an indication that Dollar prices could be what more traders are watching now. Of course, I could be completely wrong about that.
And thank you for the good insight on your post! More than happy to mention it here.
Downvoting a post can decrease pending rewards and make it less visible. Common reasons:
Submit
Excellent analysis as always and it is highly appreciated too! Thanks a bunch for it all. Namaste :)
Downvoting a post can decrease pending rewards and make it less visible. Common reasons:
Submit
Every single analysis
Downvoting a post can decrease pending rewards and make it less visible. Common reasons:
Submit
I'm afraid that you don't understand what analysis actually is.
Downvoting a post can decrease pending rewards and make it less visible. Common reasons:
Submit
It's a post-hoc fallacy, a meme, invented by gamblers/traders to make them thing they can tell the future. No scientific basis, no data, nada other than confirmation biases (noting the hits, ignoring the misses). A monkey can beat the average trader in the long run just be hodling.
More here
Why Technical Analysis In Trading is 100 Bullshit
Just because you are doing the same parroting every day, doesn't make it right. It is the same poem more or less. I explained you perfectly how someone can draw the lines, especially in the crypto world where a handful control almost everything.
Downvoting a post can decrease pending rewards and make it less visible. Common reasons:
Submit
As I was saying...
Downvoting a post can decrease pending rewards and make it less visible. Common reasons:
Submit
lol, The denial is strong with you
here is another one. You know. More "reputable"
Any Monkey Can Beat The Market which by simple inductive reasoning renders the conclusion: Technical Analysis is bullshit.
Whether one claims to understand "what it is" remains irrelevant. The "winning stories" or predictions or foresights are simple post hoc fallacies
Yet another article in case you are still in denial.
https://www.fscomeau.com/why-technical-analysis-is-bullshit/
Now, you can keep denying it or you can debate and demonstrate how what you write everyday isn't actually snake oil. I know there is massive circle-jerk due to the fact that most crypto guys are traders but still, safe spaces don't make something true.
Downvoting a post can decrease pending rewards and make it less visible. Common reasons:
Submit
It's not about predictions - it's about probabilities. You'd do well to understand that.
Downvoting a post can decrease pending rewards and make it less visible. Common reasons:
Submit
Again. No basis. None. Zero. Nada.
I can draw a chart with the probability of me farting after eating beans. That wouldn't make the chart correct or the probabilities relevant because eventually, I will fart.
Downvoting a post can decrease pending rewards and make it less visible. Common reasons:
Submit
Well this was a joy to read. If all people trading are using these crystal balls to decide when to buy or sell, I should get one also! Or buy a monkey. Tough decision.
But in these emerging markets holding for few years will be the best option for majority.
Downvoting a post can decrease pending rewards and make it less visible. Common reasons:
Submit
Technical analysis, especially price action based stuff like this isn't a crystal ball.
It just lays out the context of the market, is it trending, ranging or reversing?
Then decides places to get in and out based on probabilities and the potential for an edge.
Alot of TA is just about understanding the context and psychology of the participants. Which loosely follow patterns.
Downvoting a post can decrease pending rewards and make it less visible. Common reasons:
Submit
needs more squiggly lines
Downvoting a post can decrease pending rewards and make it less visible. Common reasons:
Submit
On each image or overall?
Downvoting a post can decrease pending rewards and make it less visible. Common reasons:
Submit
Absolutely.
Downvoting a post can decrease pending rewards and make it less visible. Common reasons:
Submit
Right on the money... Im keeping it!!!!
Also... Im now following u!!!!
Downvoting a post can decrease pending rewards and make it less visible. Common reasons:
Submit
Thank you for the graphics and information!
Downvoting a post can decrease pending rewards and make it less visible. Common reasons:
Submit
Awesome @ats-david, fancy your post.
Downvoting a post can decrease pending rewards and make it less visible. Common reasons:
Submit
Thank you once again for the great analysis :)
Downvoting a post can decrease pending rewards and make it less visible. Common reasons:
Submit
Thanks for taking the time to do this, but honestly, I am confused as ever. All this is way past my pay-grade. Cryptocurrucies and markets, geez, it might as well be Egyptian hieroglyphics to me. LOL.
Downvoting a post can decrease pending rewards and make it less visible. Common reasons:
Submit
Well, unless you're trading in these markets, it's not really that necessary to understand any of this. Just enjoy the community and the fact that you're at least earning something for being active here.
Downvoting a post can decrease pending rewards and make it less visible. Common reasons:
Submit
True analysis ! Thank you so much for your effort .

Downvoting a post can decrease pending rewards and make it less visible. Common reasons:
Submit
Congratulations @ats-david! You have completed some achievement on Steemit and have been rewarded with new badge(s) :
Click on any badge to view your own Board of Honnor on SteemitBoard.
For more information about SteemitBoard, click here
If you no longer want to receive notifications, reply to this comment with the word
STOPIf you want to support the SteemitBoard project, your upvote for this notification is welcome!
Downvoting a post can decrease pending rewards and make it less visible. Common reasons:
Submit
Devo studiare...
Downvoting a post can decrease pending rewards and make it less visible. Common reasons:
Submit
Steem moon launching!
Downvoting a post can decrease pending rewards and make it less visible. Common reasons:
Submit
Great chart analysis @ats-david . Helpful post. Up-voted and followed. I am new here please follow. Thank you.
Downvoting a post can decrease pending rewards and make it less visible. Common reasons:
Submit
One thing will remain static. 90% of the otehr cryptos will have price follow the path of bitcoin. Bitcoin and ETH are like the 'blue chips" of cryptos. Everything else is an over teh counter exchange traded crypto. If BTC were to drop an additional 25% I would imagine that STEEM drops 40%. And right now things are not looking good for the prospects of the bitcoin price. I have been outlining teh technicals on both the live bitcoin price chart...
http://bitcointicker.co
and on the U.S. exchange traded "bitcoin tracker" GBTC. I would suggest most trade GBTC over actual bitcoin because at least you know you can get out within 5 seconds if a high volume selloff occurs. No promises that Coinbase (and perhaps other exchanges) will even be able to accomodate your oder. That much we now know to be fact.
http://bigcharts.marketwatch.com/advchart/frames/frames.asp?show=&insttype=&symb=gbtc&x=52&y=12&time=18&startdate=1%2F4%2F1999&enddate=2%2F18%2F2017&freq=7&compidx=aaaaa%3A0&comptemptext=&comp=none&ma=0&maval=9&uf=0&lf=1024&lf2=2&lf3=8&type=2&style=320&size=4&timeFrameToggle=false&compareToToggle=false&indicatorsToggle=false&chartStyleToggle=false&state=9
Downvoting a post can decrease pending rewards and make it less visible. Common reasons:
Submit
Yeah, that's a great point. Trading Bitcoin on the current crypto exchanges isn't ideal and even if you wanted to cash out your earnings, you'll could end up waiting hours or days to do so. If you're only interested in trading the market and cashing out your profits, then GBTC might be the way to go.
Downvoting a post can decrease pending rewards and make it less visible. Common reasons:
Submit
Makes sense to me any way. Right now I would imagine you can't even trade GBTC short as I'm am sure the shares available to short are already locked up as hedge positions by those who already own most of the float. If teh volume picks up then it may eventually trade options. And the technicals are pretty easy to game. I outlined a buy signal today that would have gotten you in long at $400 (that was an easy $40 per share profit within maybe 2 hours of trading and if one wasn't smart enough to bank that gain then it won't help you to follow me anyway). My blogs on GBTC should always be tehre and available for "verification" on any argument I make. I may go long GBTC personally at some point...but my "some point" would make most of you guys think I am simply here to piss in your punch bowl. So I won't reveal that "target" number. I do in one of the spews I posted tho. :-)
Downvoting a post can decrease pending rewards and make it less visible. Common reasons:
Submit
Very good analysis. Resteemed :-)
Downvoting a post can decrease pending rewards and make it less visible. Common reasons:
Submit
Thank you, sir!
Downvoting a post can decrease pending rewards and make it less visible. Common reasons:
Submit
I have to thank you for your kind support :-)
Downvoting a post can decrease pending rewards and make it less visible. Common reasons:
Submit
Great explanation, but i dont understand yet about crypto
Downvoting a post can decrease pending rewards and make it less visible. Common reasons:
Submit
Very good post my friend, upvote. Here is a post for you to enjoy a little sudden trip. regards..
Https://steemit.com/life/@jorlenbolivar/a-small-journey-from-your-machine-into-the-universe-open-this-post-without-compromise-you-will-not-lose-anything
Downvoting a post can decrease pending rewards and make it less visible. Common reasons:
Submit
Based on the information in this analysis, I have come to the conclusion that I have NO IDEA WHAT THE HECK I AM DOING...(following you for help)

Downvoting a post can decrease pending rewards and make it less visible. Common reasons:
Submit
What are your goals? What you want to accomplish will likely dictate what you should be doing. Let's start there!
Downvoting a post can decrease pending rewards and make it less visible. Common reasons:
Submit
My hope is to turn some of my paragliding stories and lessons into enough money to support my flying habit. I have about $50 SBDs at this point. I have created a BTCC account. Thats as far as I have made it. I am new to the crypto scene.
Downvoting a post can decrease pending rewards and make it less visible. Common reasons:
Submit
cool post
Downvoting a post can decrease pending rewards and make it less visible. Common reasons:
Submit
what about sbd?
Downvoting a post can decrease pending rewards and make it less visible. Common reasons:
Submit
https://coinmarketcap.com/currencies/steem-dollars/
Downvoting a post can decrease pending rewards and make it less visible. Common reasons:
Submit
Great analysis, let me think what to do next days!
Thank you!
Downvoting a post can decrease pending rewards and make it less visible. Common reasons:
Submit
If trading was easy everyone would be doing it.... I guess that is why our population keeps growing
Downvoting a post can decrease pending rewards and make it less visible. Common reasons:
Submit
nice...resteem and upvote for your...
Downvoting a post can decrease pending rewards and make it less visible. Common reasons:
Submit
Fantastic work with the analysis @ats-david! Thanks for putting this together! See you at SteemFest 2017? :D
Downvoting a post can decrease pending rewards and make it less visible. Common reasons:
Submit
Thanks! Not sure I'll be making it to SteemFest, but we'll see what happens!
Downvoting a post can decrease pending rewards and make it less visible. Common reasons:
Submit
Sure :) Keep updating us with the analysis though :)
Downvoting a post can decrease pending rewards and make it less visible. Common reasons:
Submit
It may have taken a lot of damage, but I'm not discouraged... for me, the Steem Train... HAS NO BRAKES! >:3
Downvoting a post can decrease pending rewards and make it less visible. Common reasons:
Submit
awesome awesome steem price analysis.. hey can you help a friend out https://steemit.com/food/@whitedolphin/delicious-easy-urban-eatery-urban-plates-del-mar-highlands-san-diego-california-review and vote if you like.
Downvoting a post can decrease pending rewards and make it less visible. Common reasons:
Submit
You do keep the competition at the top tough.
You and @sweetsssj.
Downvoting a post can decrease pending rewards and make it less visible. Common reasons:
Submit
She's a darling! I can't compete with her! It's a nice thought though.
Downvoting a post can decrease pending rewards and make it less visible. Common reasons:
Submit
Keep feeding the inspiration boss man!
Downvoting a post can decrease pending rewards and make it less visible. Common reasons:
Submit
Awesome, let's hope Steem goes up up and up :)
Downvoting a post can decrease pending rewards and make it less visible. Common reasons:
Submit
Thanks a lot. Very interesting topic. A good analysis)
Downvoting a post can decrease pending rewards and make it less visible. Common reasons:
Submit
Exelente, a well put realist amnalisys.
Downvoting a post can decrease pending rewards and make it less visible. Common reasons:
Submit
For some reason, I believe Steem will stay around the same price for 1 year, with a variation of 20%
Downvoting a post can decrease pending rewards and make it less visible. Common reasons:
Submit
Thank you!
Downvoting a post can decrease pending rewards and make it less visible. Common reasons:
Submit